Trinetra: Server Monitoring That Stays Quiet Until It Matters
Most of the servers we look after are not in a data centre. They are a few VPSes, a database box, a Raspberry Pi running backups in a cupboard, a client's two machines in someone else's cloud. The monitoring advice for that kind of estate is still the advice for a data centre: run an exporter on every box, a scraper and a time-series database somewhere, a dashboard service, an alert manager, and wire them together in YAML. Then monitor the monitoring.
We wanted something smaller that still did the part that matters, which is telling the right person, once, when something is actually wrong. So we built Trinetra: one small Go daemon per Linux server that watches the box, keeps its own history, decides on its own when something is wrong and tells you on Telegram. When you have more than one server, the same daemon becomes a fleet master that groups alerts into incidents, routes them and escalates. Trinetra 0.5.0 is out today, source-available under FSL-1.1-ALv2.
sudo ./trinetra install --require-signed
sudo trinetra telegram set-token 123456789:AAExampleToken
# then, from your phone:  /start <pin>  →  /stats
Trinetra is Sanskrit for the third eye, the one that sees what the other two miss. The name is a promise about behaviour as much as vision: it watches all the time and opens only when something needs you.
One daemon, not a stack

The usual stack, and the alternative.
Each server runs one binary, trinetra. It samples the fast metrics (CPU, load, memory, swap) every 5 seconds and the slow ones (filesystems, containers, systemd units, SMART, network, processes, reachability) every minute. It writes history to a compact on-disk store with tiered retention, 48 hours of raw samples and 30 days of one-minute rollups, and evaluates its own alert rules. Nothing about a single server depends on any other machine being up.
We measured it on Linux containers with 8 vCPUs over about 72 minutes, sampling six times faster than the default:
| Measured | |
|---|---|
| Core binary | 11.8 MB static on amd64, 10.9 MB on arm64; 4.3 to 4.7 MB gzipped |
| Memory | 11.6 MB RSS on its own, 12.4 MB as a fleet child, 14.0 MB as a master with two children |
| CPU | About 0.4% of one core on its own |
| Disk | About 0.3 MB of history per host after the first hour |
| Third-party code in the daemon | None. It is Go's standard library, and a test fails the build if that changes. |
Everything heavy is a separate program. The web UI (trinetra-web) and the terminal UI (trinetra-ctl) are plugins that talk to the daemon over a local, token-authenticated unix socket, so the WebAuthn stack and the TUI libraries never enter the process that decides whether to page you. The daemon only runs a plugin after checking its owner, its permissions and a SHA-256 recorded at install.
Alerts you can predict
Every check is in one of two states, firing or clear, and Trinetra only speaks when that changes. A disk that stays full for twenty minutes is one message when it fills and one when it clears, not twenty. Alert state is stored on disk, so a reboot does not re-send everything it already told you.
The rules are plain arithmetic. A static threshold fires when a reading meets or exceeds a number you can read with trinetra config get. An optional baseline check fires when a reading is far from that box's own rolling mean. It needs both enough standard deviations and a real relative change, because we found in practice that cpu and temperature on a quiet home server sit "many sigma" from a low, unstable mean all day long. That branch is off by default for exactly that reason. There is no model in the decision path, so you can always work out why something fired.
When CPU or memory fires, the message names the culprit it already collected:
[db-01] cpu = 96.0 ≥ threshold 95.0 (top: ffmpeg 82%, container web 30%)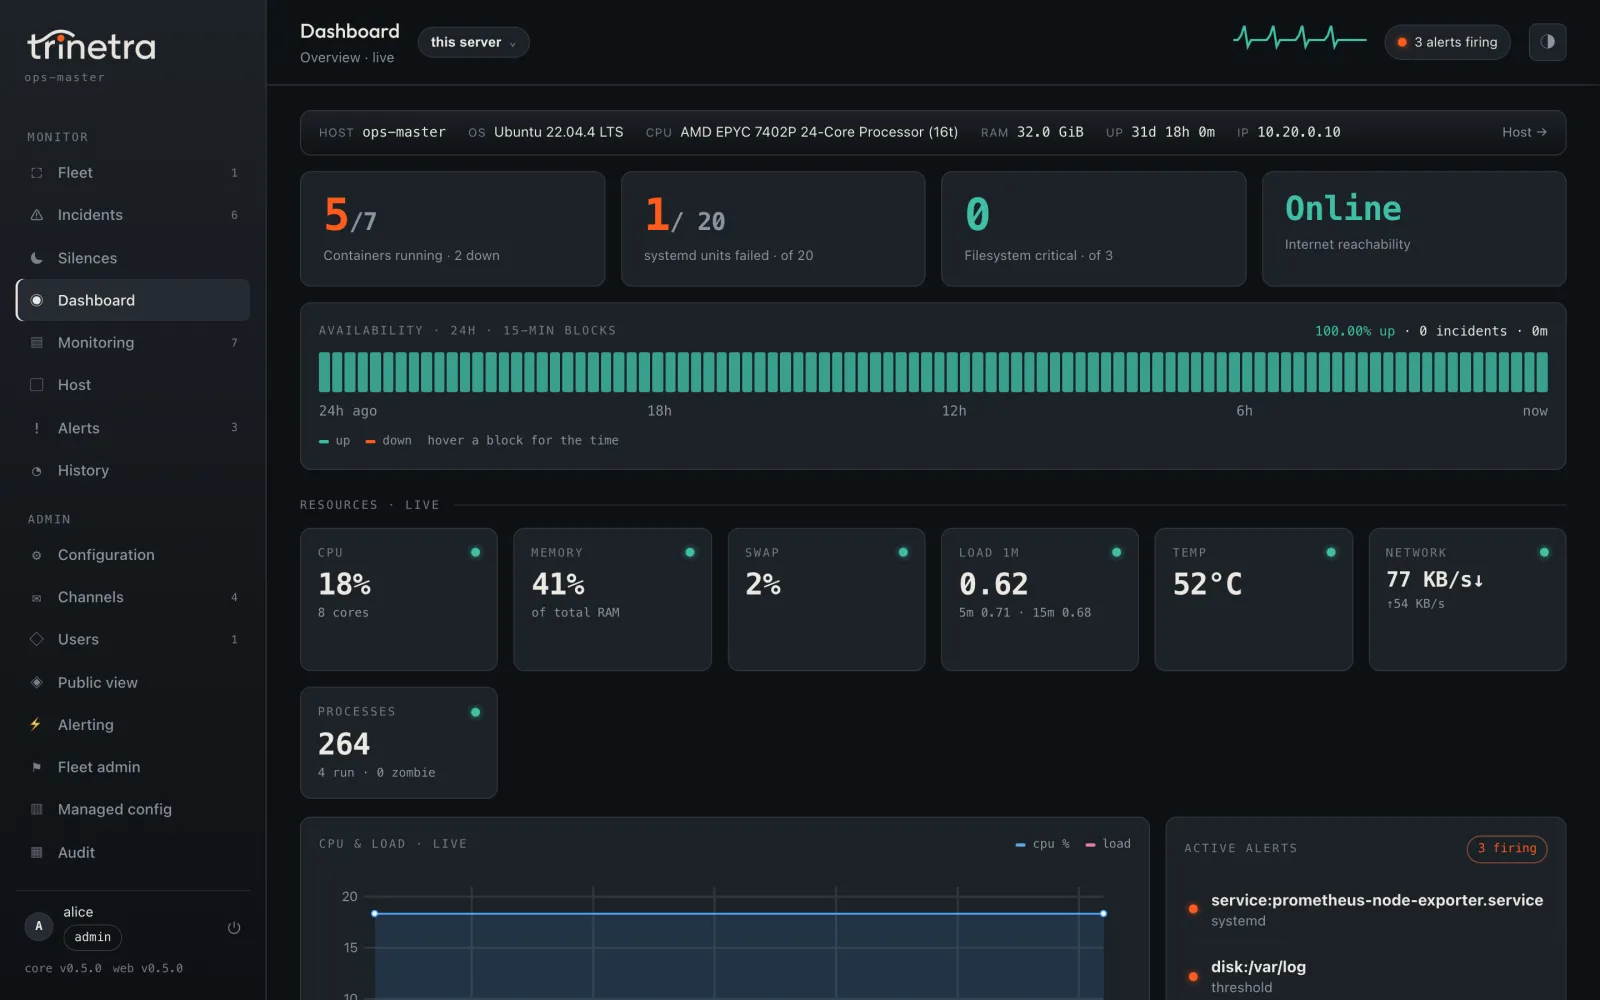
The dashboard in the web UI. Every screenshot here comes from a demo fleet with made-up names and addresses.
Telegram is the first-class channel. The bot answers /stats, history and controls, and it answers only one chat: after you set the token, the daemon holds a one-time six-digit PIN, and the bot ignores everyone until someone sends /start with it. Email, Slack, Discord, ntfy, Gotify and a generic webhook are the other six channels, each with its own severity floor and quiet-hours rule. A dead-man switch on healthchecks.io covers the one case no daemon can: the box itself being off.
A fleet without a single point of silence
With more than one server, turn one of them into a master and enroll the rest:
# on the master
sudo trinetra fleet init --address monitor.example.com
sudo trinetra fleet token create --tags prod --uses 3

# on each server
sudo trinetra fleet join swj1_...
The join code carries a pin of the master's certificate authority, so a child never trusts on first use, and from then on every child talks to the master over mutual TLS with its own 90-day certificate that renews itself. Revoking a node cuts it off at the next request.
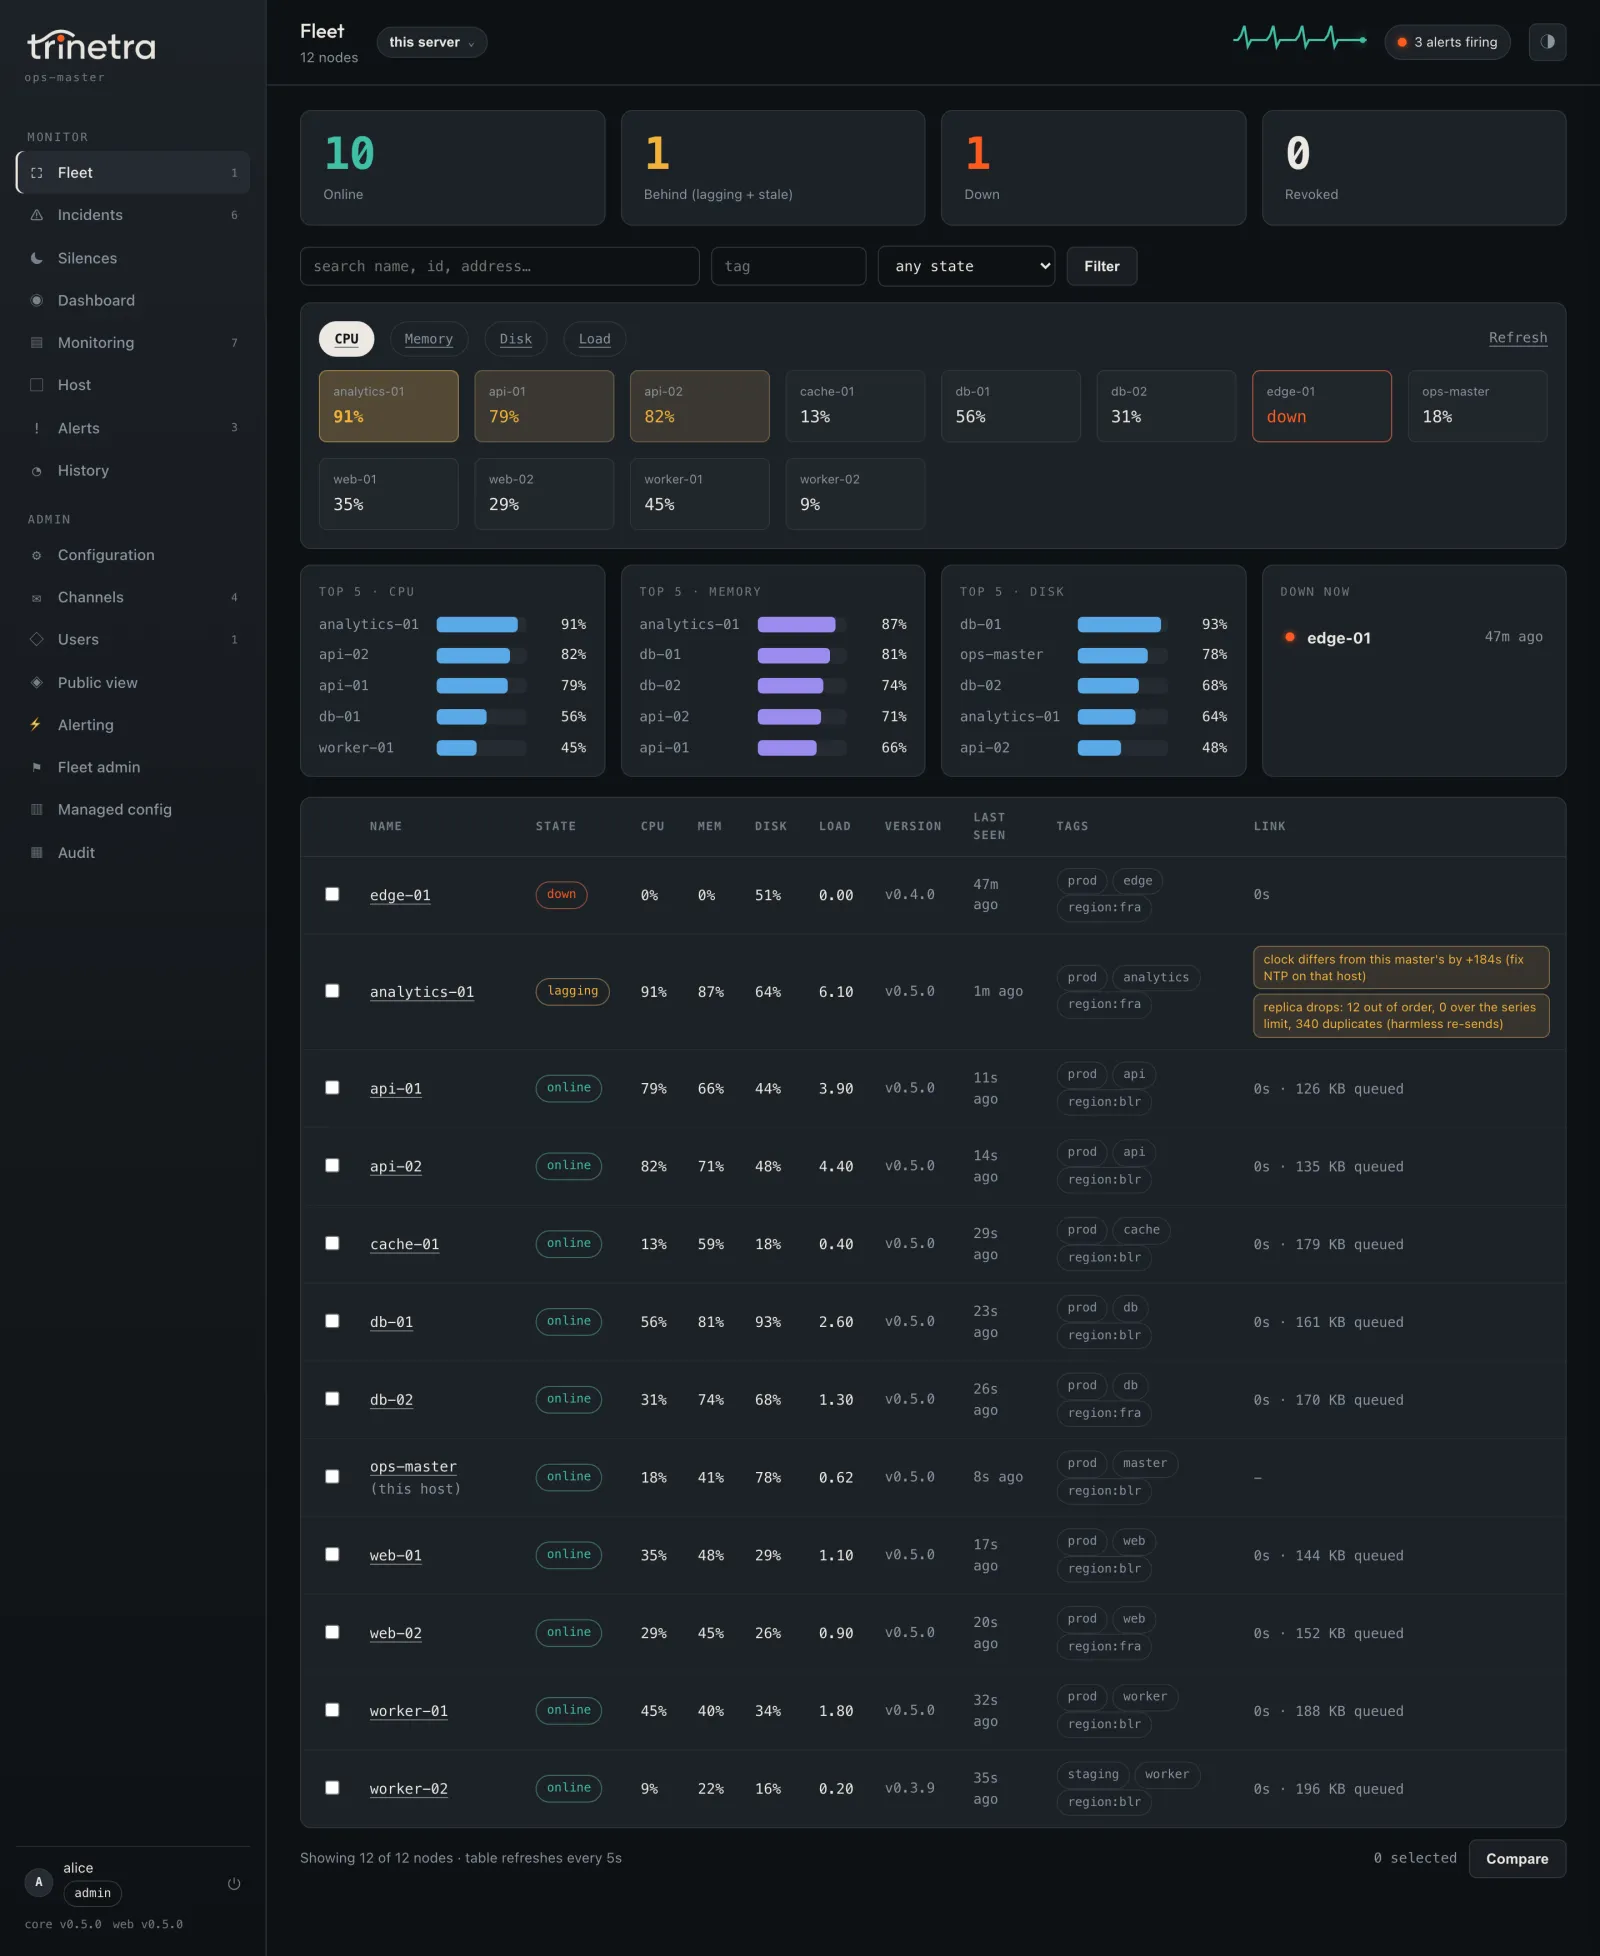
The fleet overview on the master. Ctrl-K opens any node's own dashboard from the master's copy of its data.
The design rule for the fleet was that joining one must never make a server less safe than it was alone. A child keeps sampling, storing and detecting exactly as before. It ships a copy of its history to the master through an outbox on disk (512 MB by default), so an outage only delays the copy, and when the outbox fills, the oldest range is recorded as a gap and rebuilt from the child's own history afterwards.
Alerts work the same way. A child hands a firing alert to the master, and if no receipt comes back within two minutes, it delivers the alert itself, marked via local fallback: master unreachable. The master deduplicates on node, alert and fire time, so whichever side sends it first, it arrives once. If half or more of the fleet goes quiet at the same moment, the master raises one "fleet connectivity" alert instead of a page per node, because that is almost always the master's own network.
Ten servers, one page

Many alerts, one page.
On the master, alerts become incidents. By default alerts with the same rule and severity share one, so ten web servers with the same full disk page you once. A node can declare what it depends on, and when a database is down, the api nodes that depend on it fold into its incident instead of paging on their own.
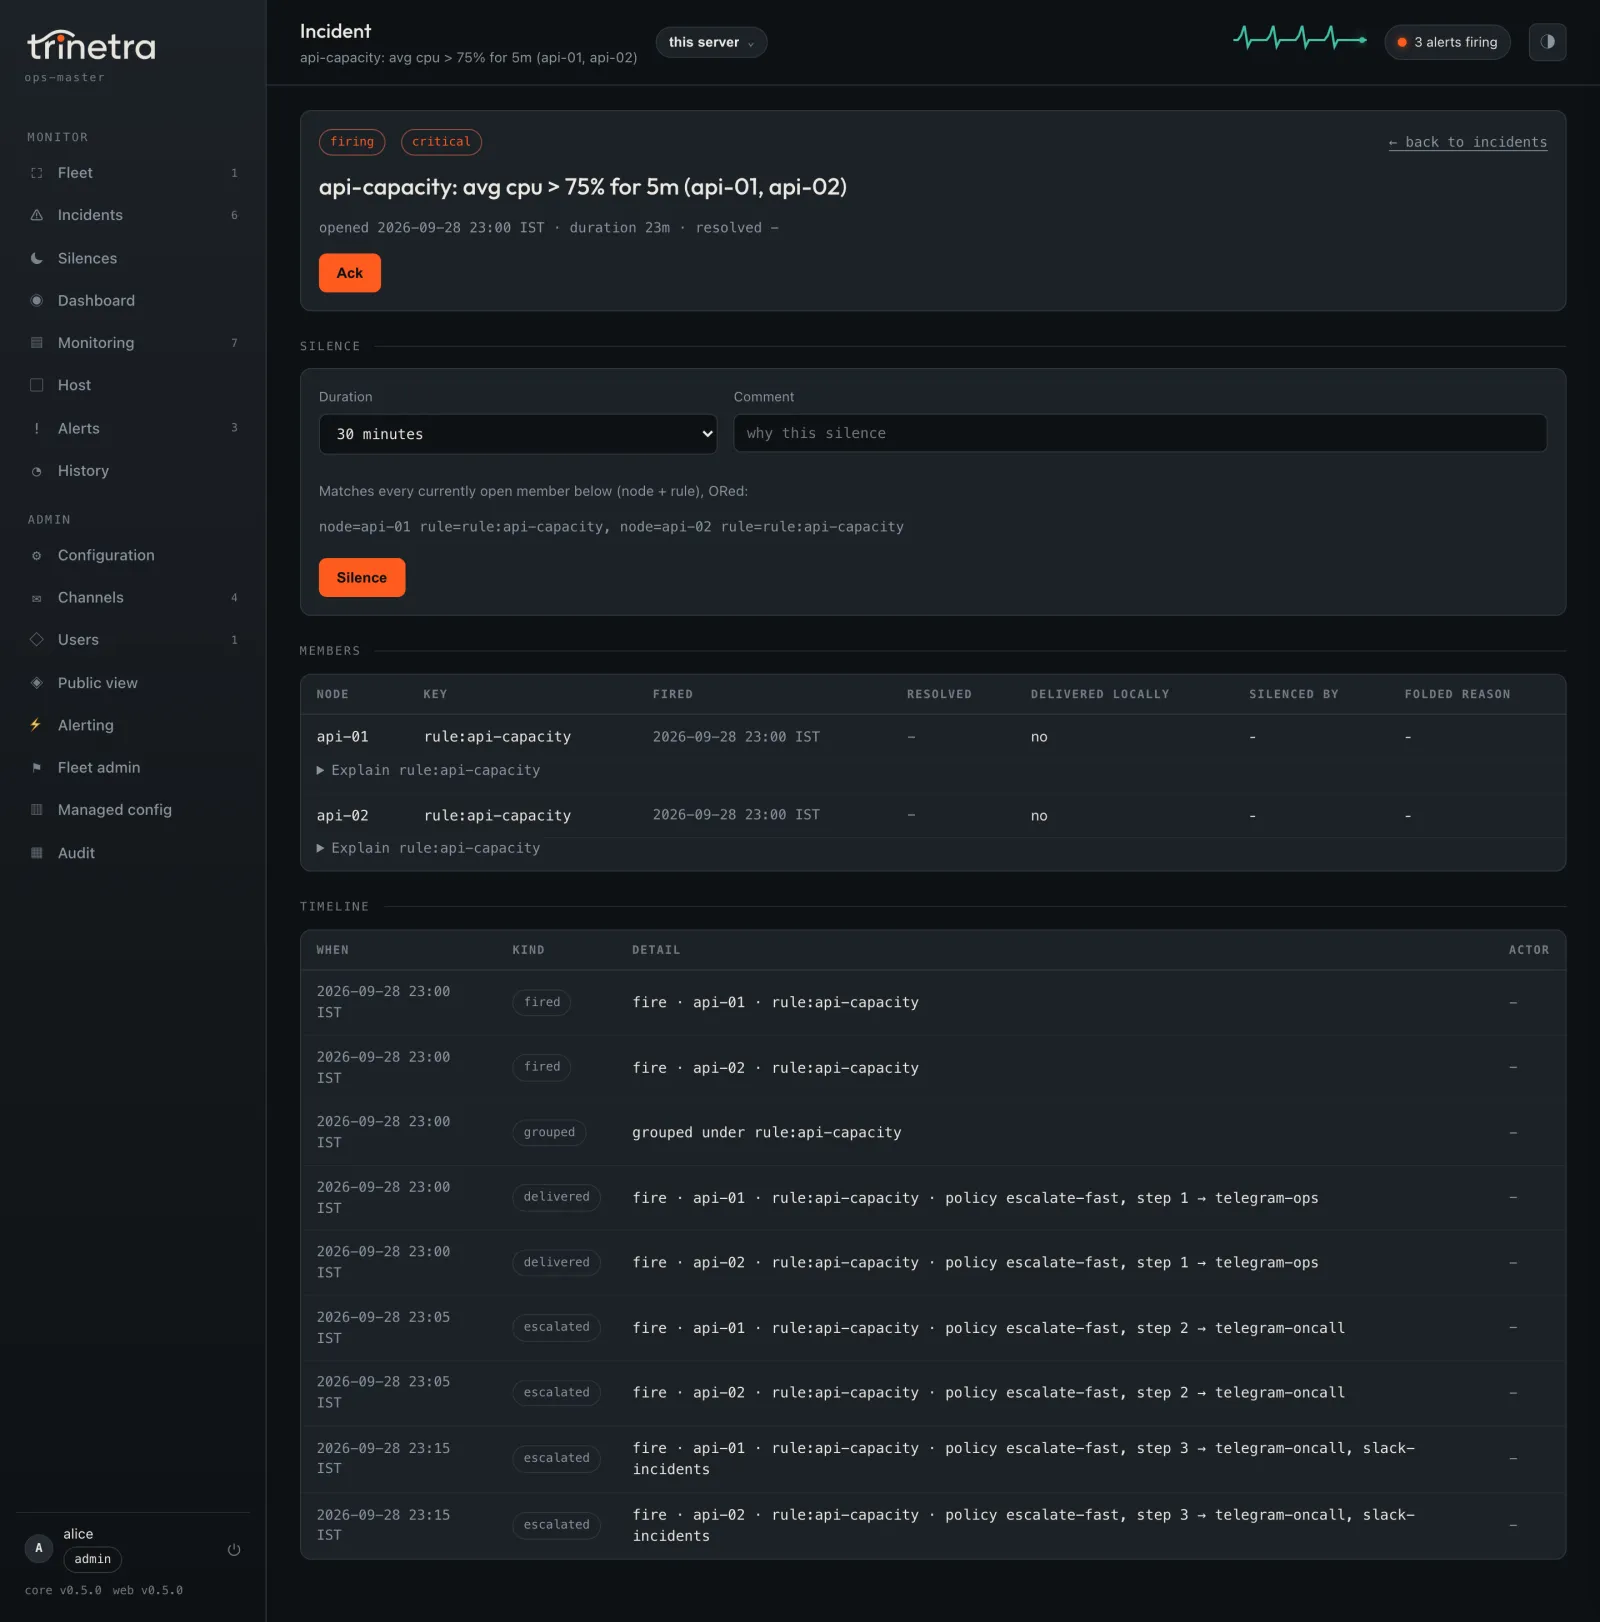
An incident's timeline shows what fired, what was grouped, who was told and when it escalated.
Routes match on tag, node, rule and severity and hand an incident to an escalation policy: the ops chat now, on-call after five minutes, everyone after fifteen. The master's Telegram messages carry Ack and Silence 1h buttons, so stopping an escalation is one tap. Silences and weekly maintenance windows are pushed down to every child, so a child delivering on its own during an outage still honours them. When you want to know why you were or were not paged, trinetra fleet explain prints every step an alert took.
For rules about a tier rather than a host, the master evaluates a small grammar every 30 seconds. It is deliberately not PromQL:
avg(tag:api, cpu) > 75 for 5m
online(tag:prod) < 8 for 2m
count(tag:web, disk > 90) >= 1 for 5m
absent(tag:backup, 15m)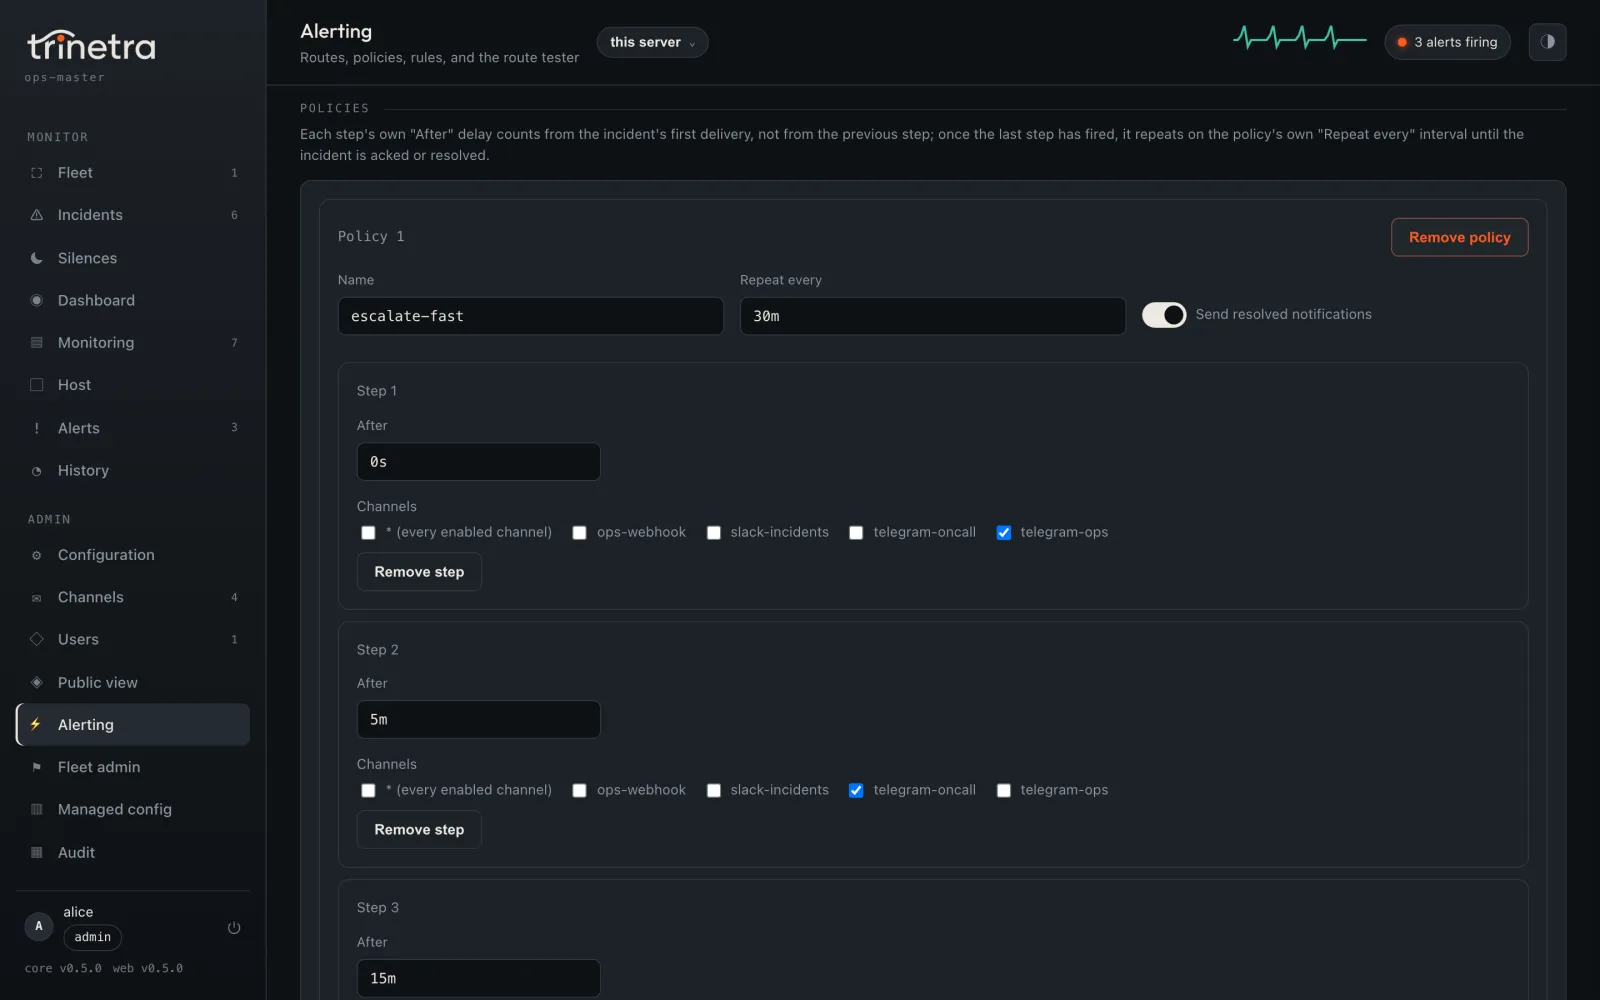
Escalation policies. Routes and policies can be edited in the form or as JSON, and tested before you save.
Updates that cannot be forged by one party
A monitoring daemon runs as root on every server you have, so how it updates matters more than most features. Every Trinetra release ships a manifest of exact file sizes and hashes, signed by the build pipeline and co-signed offline by a maintainer. A host installs nothing unless both Ed25519 signatures verify against keys compiled into the binary it is already running, and it treats GitHub and the network as untrusted transport. A version floor refuses downgrades, and signed channel pointers expire after 14 days so a withheld update raises an alert.
trinetra update apply restarts under a guard that keeps the previous build. If the new daemon is not healthy within 90 seconds, it rolls back and marks that version bad, and a systemd timer finishes the job even across a crash or reboot. You can also verify any release by hand with sha256sum and OpenSSL, without trusting Trinetra at all; the docs walk through it.
One limit, stated plainly: the co-signature proves the maintainer approved these exact hashes, not that CI built them honestly from the tagged source. A reproducible-rebuild check in the co-signing tool is the planned fix.
How it compares
There is no shortage of monitoring tools, and several of them are excellent. This is where Trinetra sits among the ones people most often run on a handful of Linux servers, as of the end of September 2026. Every figure below comes from the project's own documentation, repository or pricing page; where a vendor does not publish a number, we say so rather than estimate one.
| What you run | Memory per host | Where alerts are decided | If the central server is down | Licence | |
|---|---|---|---|---|---|
| Trinetra 0.5.0 | One daemon per server; one of them can be the fleet master | 11.6 MB (measured, above) | On every host | Every host still alerts; children deliver their own alerts after 2 minutes | FSL-1.1-ALv2, Apache-2.0 after two years |
| Netdata 2.11 | An agent per server, optional parent nodes, optional Netdata Cloud | 100–200 MB on an empty system, 250–350 MB in typical production (Netdata docs) | On every agent | Agents keep alerting | Agent: GPL-3.0 |
| Prometheus 3.15 + Alertmanager + Grafana | node_exporter per server, a Prometheus server, Alertmanager, Grafana | node_exporter: not documented | On the Prometheus server (docs) | No rules are evaluated, so nothing fires, unless you run it highly available | Apache-2.0; Grafana is AGPL-3.0 |
| Zabbix 7.0 | An agent per server, a Zabbix server, a database and a web frontend | Not documented | On the Zabbix server | No alerts | AGPL-3.0 since 7.0 (Zabbix) |
| Beszel 0.20 | An agent per server and one hub | Not documented | On the hub | No alerts | MIT |
| Uptime Kuma 2.5 | One server, no agent: it checks your services from outside | No agent | On the server | No alerts | MIT |
| Datadog | An agent per server and Datadog's cloud | Not compared | In Datadog's cloud | Out of your hands | Proprietary service; agent is Apache-2.0. $15 per host a month (Pro, annual) (pricing) |
Where Trinetra is the better fit:
- Small estates that nobody wants to babysit. There is nothing to run besides the servers themselves: no database, no scraper, no separate alerting service to keep alive. The daemon uses 11.6 MB; Netdata documents 100 to 200 MB for its agent on an empty system.
- Alerting that survives the monitor. In every centralised design above, the box that decides whether to page you is a single point of silence. In Trinetra each host decides for itself, and the master adds grouping and escalation on top without becoming a dependency.
- Fewer, better pages. Incidents, dependency folding, escalation policies, silences and maintenance windows are built in. Alertmanager and Zabbix can do most of this with configuration. Beszel and Uptime Kuma send an alert per check or metric.
- A careful update path. Two-party signed releases, a downgrade floor and automatic rollback matter for software that runs as root on every server you own.
Where something else is the better choice, and we would say so to a client:
- Netdata if you want per-second metrics, thousands of charts out of the box and machine-learning anomaly detection. Trinetra samples every 5 and 60 seconds and keeps its alert rules deliberately simple.
- Prometheus and Grafana if you already run them, need custom application metrics, PromQL, or exporters for everything from databases to switches. Trinetra exports nothing to Prometheus today.
- Zabbix for large or mixed estates: network gear over SNMP, Windows, thousands of hosts, and a deep library of templates.
- Uptime Kuma for checking websites and APIs from the outside, with polished public status pages. Trinetra watches the inside of a server; pair them if you need both.
- Beszel if you want a permissive MIT licence and a Docker-first dashboard. Trinetra is source-available, not open source in the OSI sense.
- Datadog or another hosted platform when you need logs, traces and APM in one place and would rather pay than operate.
And if you run macOS or Windows servers, Trinetra is not for you yet.
What is not done yet
- Linux with systemd only. There is no macOS or Windows build and no official container image.
- Fleet screens in the terminal UI and fleet commands in the Telegram bot. The web UI has them; the other two do not yet.
- Per-interface throughput alerts. Network throughput is collected and charted, but nothing alerts on it.
- Channel checks in the web UI. Saving a channel there does not test it end to end yet;
trinetra channel testand the terminal UI do. - Fleet-wide rollout of updates. Each host updates when you run
update apply. Rolling a release out through the master, with canaries and maintenance windows, is designed but not built. - Metrics export. Nothing speaks Prometheus or remote-write.
Try it
Pick your server's architecture, x86-64, ARM64 or ARMv7, and follow the install guide. It takes three downloads, one install and a bot token. The product page has a simulation of a fleet you can break in your browser, the docs cover the web UI, channels, fleets and updates, and the source is on GitHub.
Trinetra is free to use, self-host and modify, commercially too, as long as you are not offering it as a competing product or service. Each release becomes Apache-2.0 two years after it ships, and releases up to v0.4.1, published as serverwatch, stay MIT. If you run serverwatch today, sudo trinetra install migrates it in place and keeps your history, alert state and enrollment.