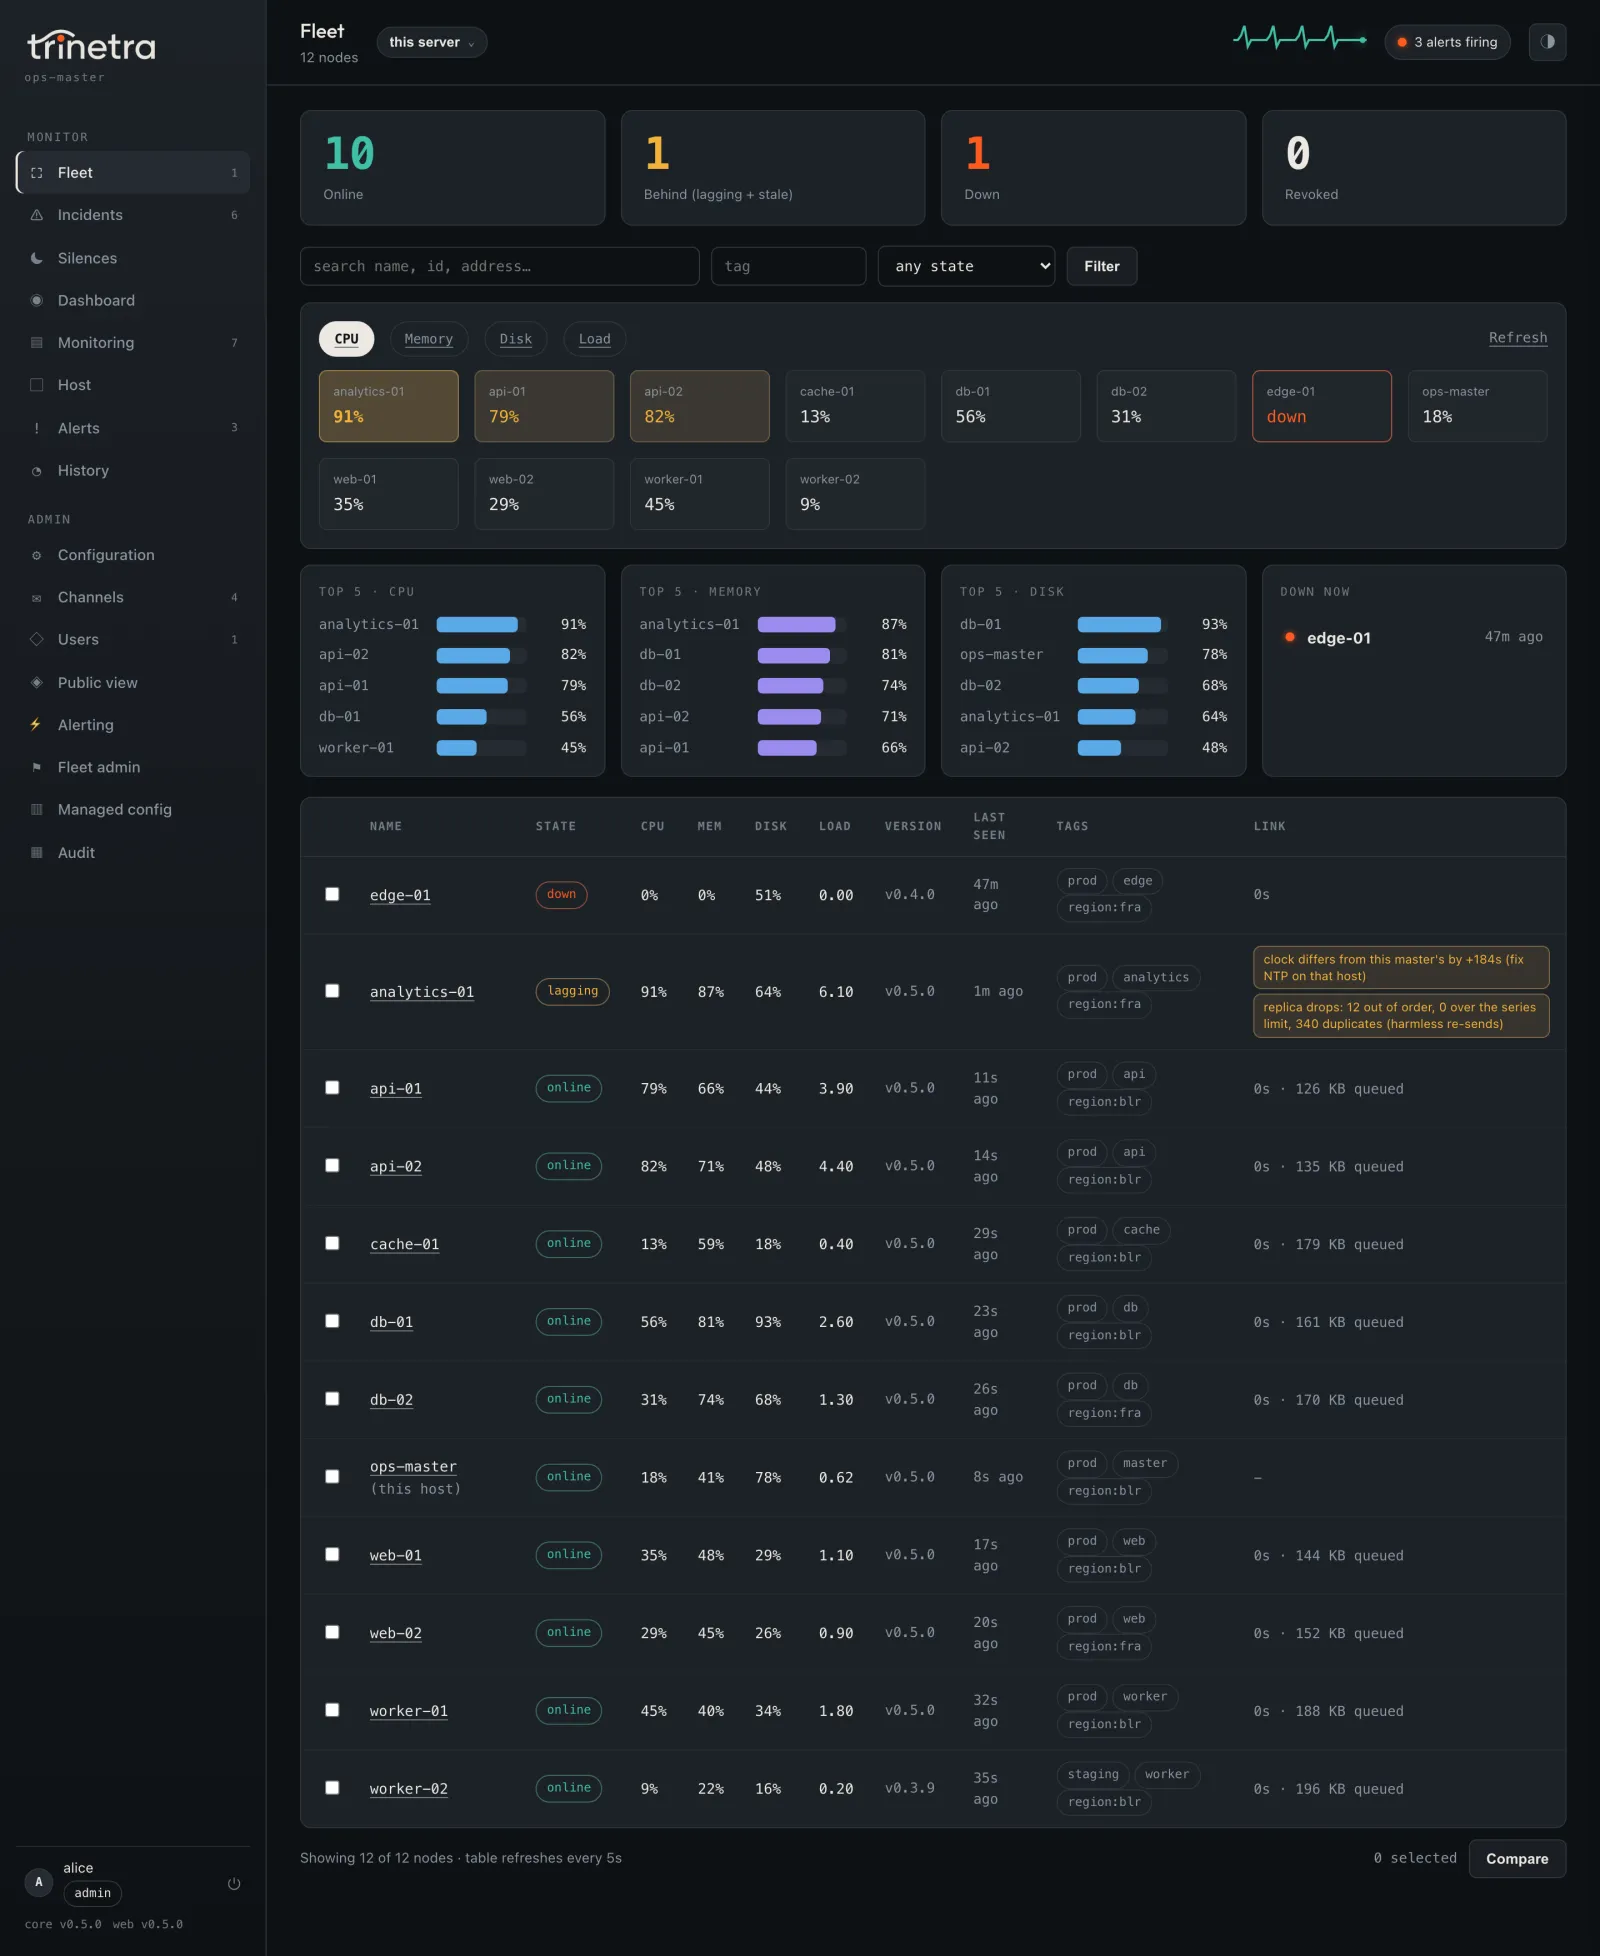
Every node at a glance.
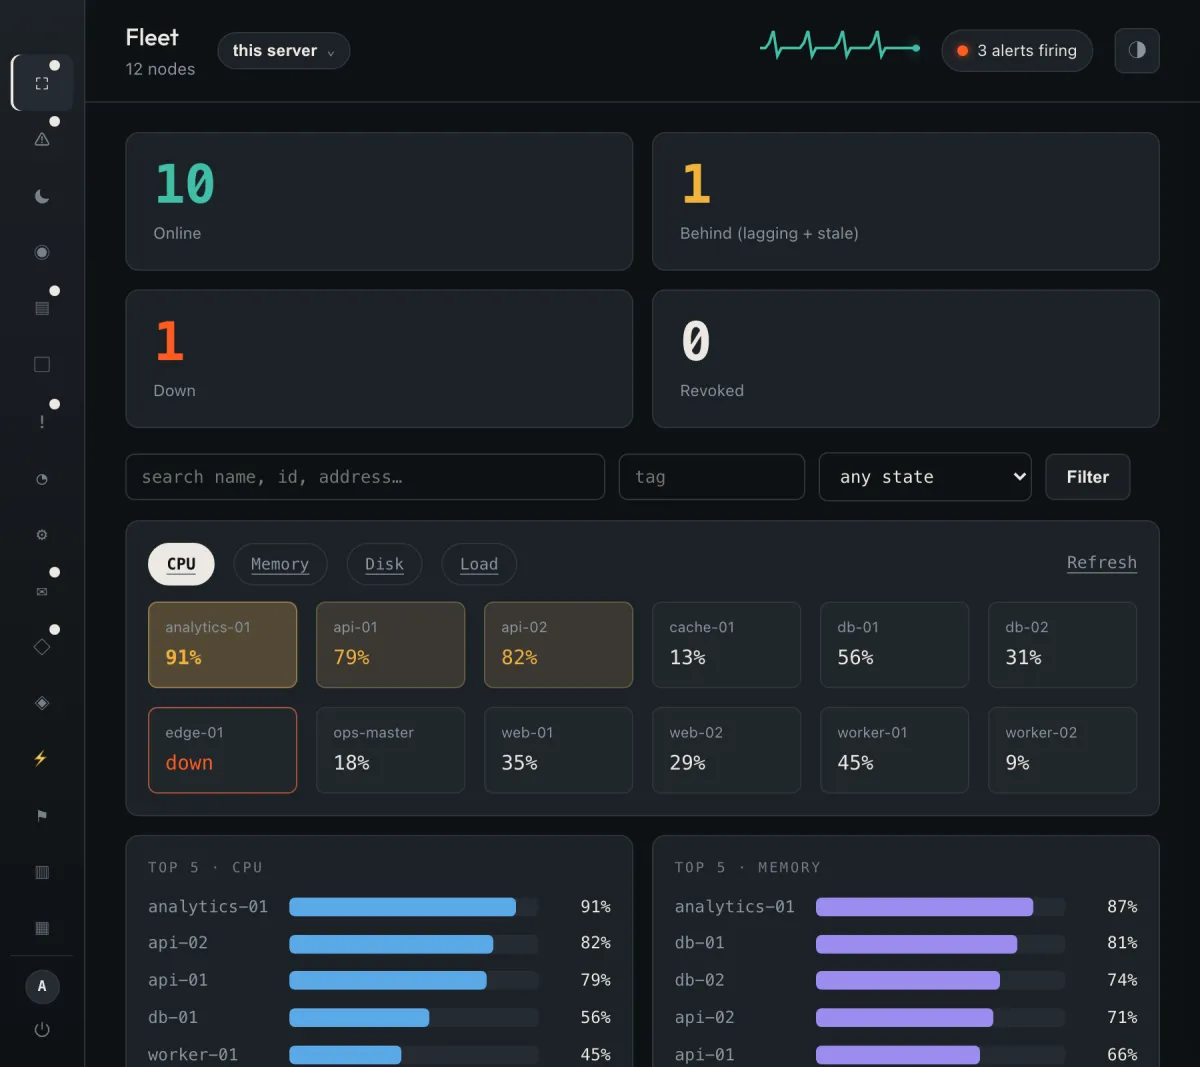
Online, lagging, down and revoked counts, a heatmap you can switch between CPU, memory, disk and load, top-five lists and link health. Ctrl-K or ⌘-K opens any child's full dashboard from the master's copy of its data.
 Sees what you can’t.
One small daemon per Linux server watches the box, keeps its own history and tells you on Telegram when something is wrong. When you have more than one server, the same daemon becomes a fleet master that groups alerts into incidents, routes them and escalates. No cloud, no Prometheus, no external database.
Nine servers, one of them the master. Nothing is wrong, so nothing is sent. Pick a failure.
A simulation of a Trinetra fleet in your browser, on the handbook’s timings: stale after 30 seconds, down after 2 minutes, a 30-second wait to group alerts, and a child delivering its own alert when the master has not confirmed it within 2 minutes. Time runs thirty times faster.
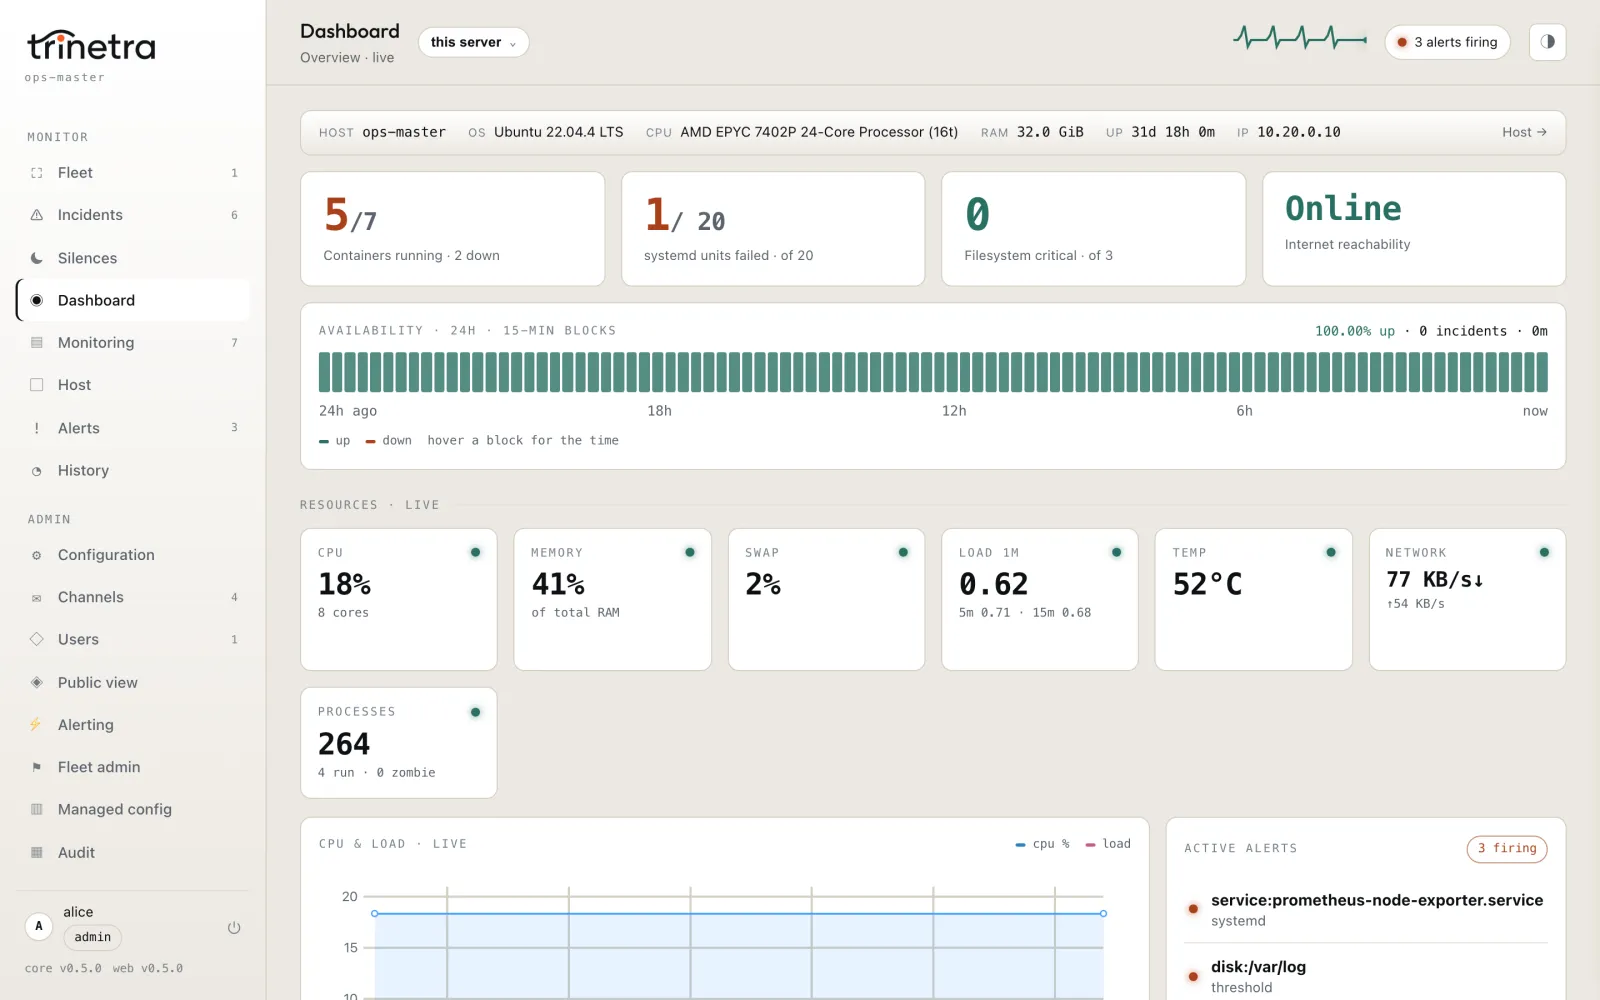
Containers, systemd units, filesystems, reachability, a 24-hour availability strip, CPU, memory, swap, load, temperature, network and processes, streamed live, with whatever is firing right now.
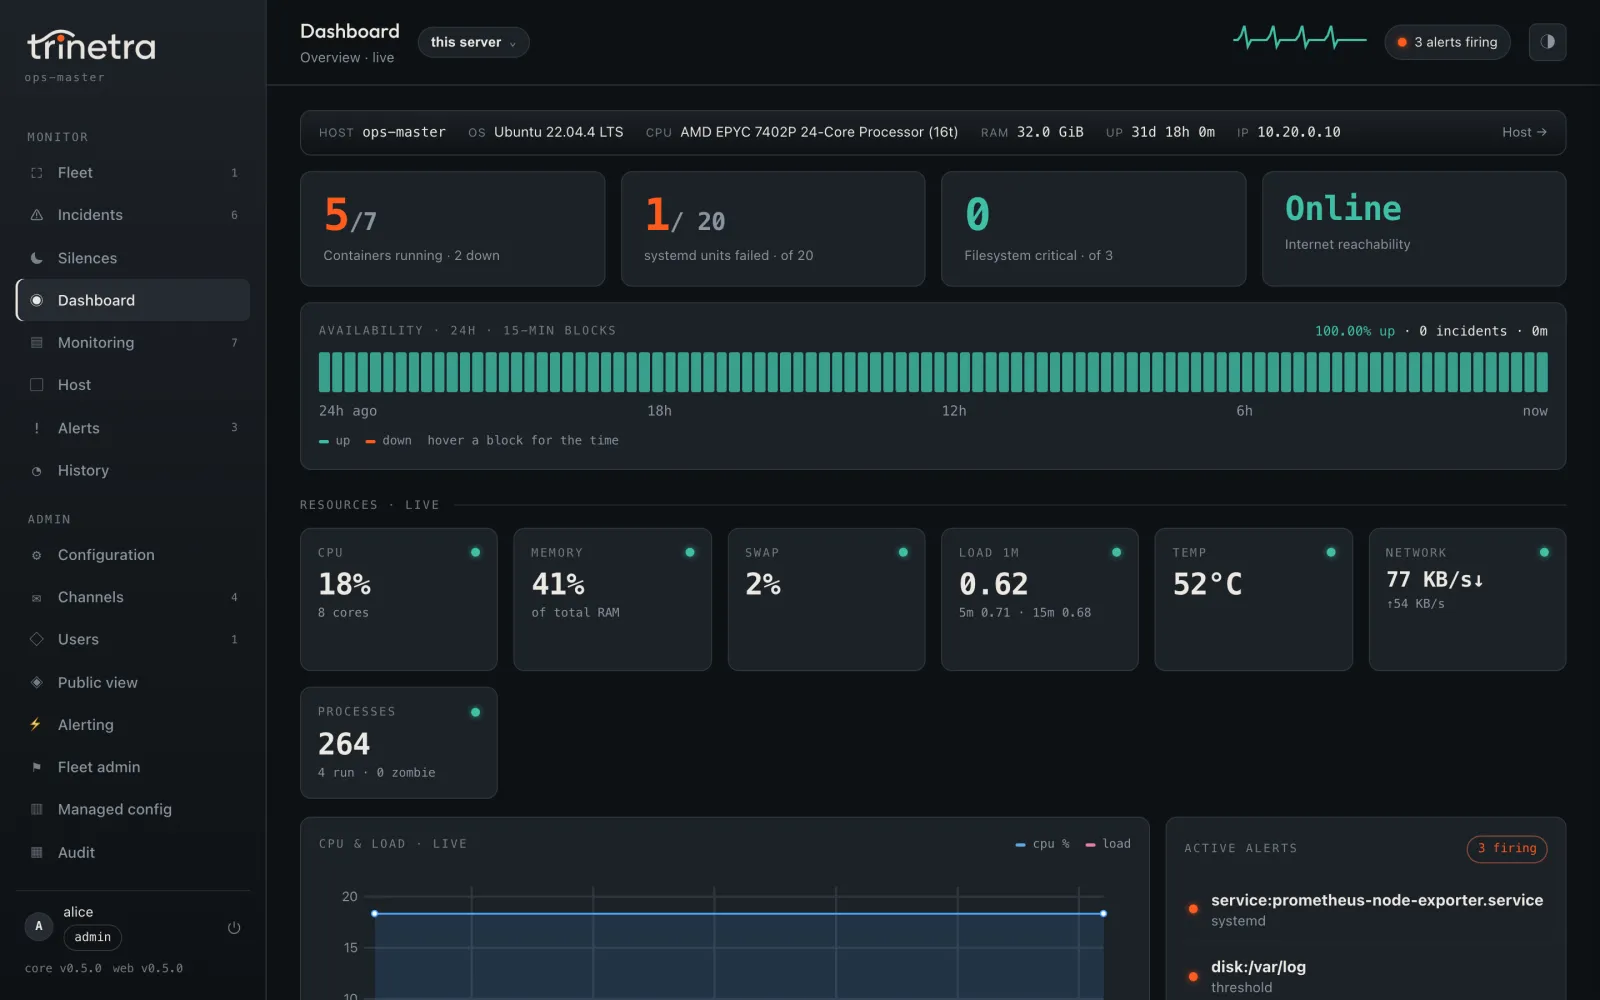
The real web UI, trinetra-web, on a demo fleet of twelve servers. Host names, addresses and users are made up.
Static thresholds, and an opt-in baseline that asks whether a reading is normal for this box. Both are plain arithmetic, so you can predict when an alert fires. No AI decides.
Every setting goes through the CLI or the terminal UI, which validate it and write one private config file atomically. Most changes apply without a restart.
Every host alerts on its own. In a fleet, a child hands alerts to the master and delivers them itself if the master does not answer.
Each check is either firing or clear, and Trinetra only speaks when that changes. A disk that stays full for twenty minutes is one message, not twenty. Drag the threshold and count.
A CPU or memory alert also names the culprit, the top process and container, so it reads like cpu = 96.0 ≥ threshold 95.0 (top: ffmpeg 82%, container web 30%). Active alerts survive a restart, so a reboot does not re-send everything that was already known.
disk:/ = 86.2 ≥ threshold 85.0disk:/ back to normalEach channel has its own severity floor, its own kinds of alert and its own quiet-hours rule, so the ops chat hears everything and email hears only criticals. Boot and recovery reports, a daily digest and a weekly rollup travel the same way.
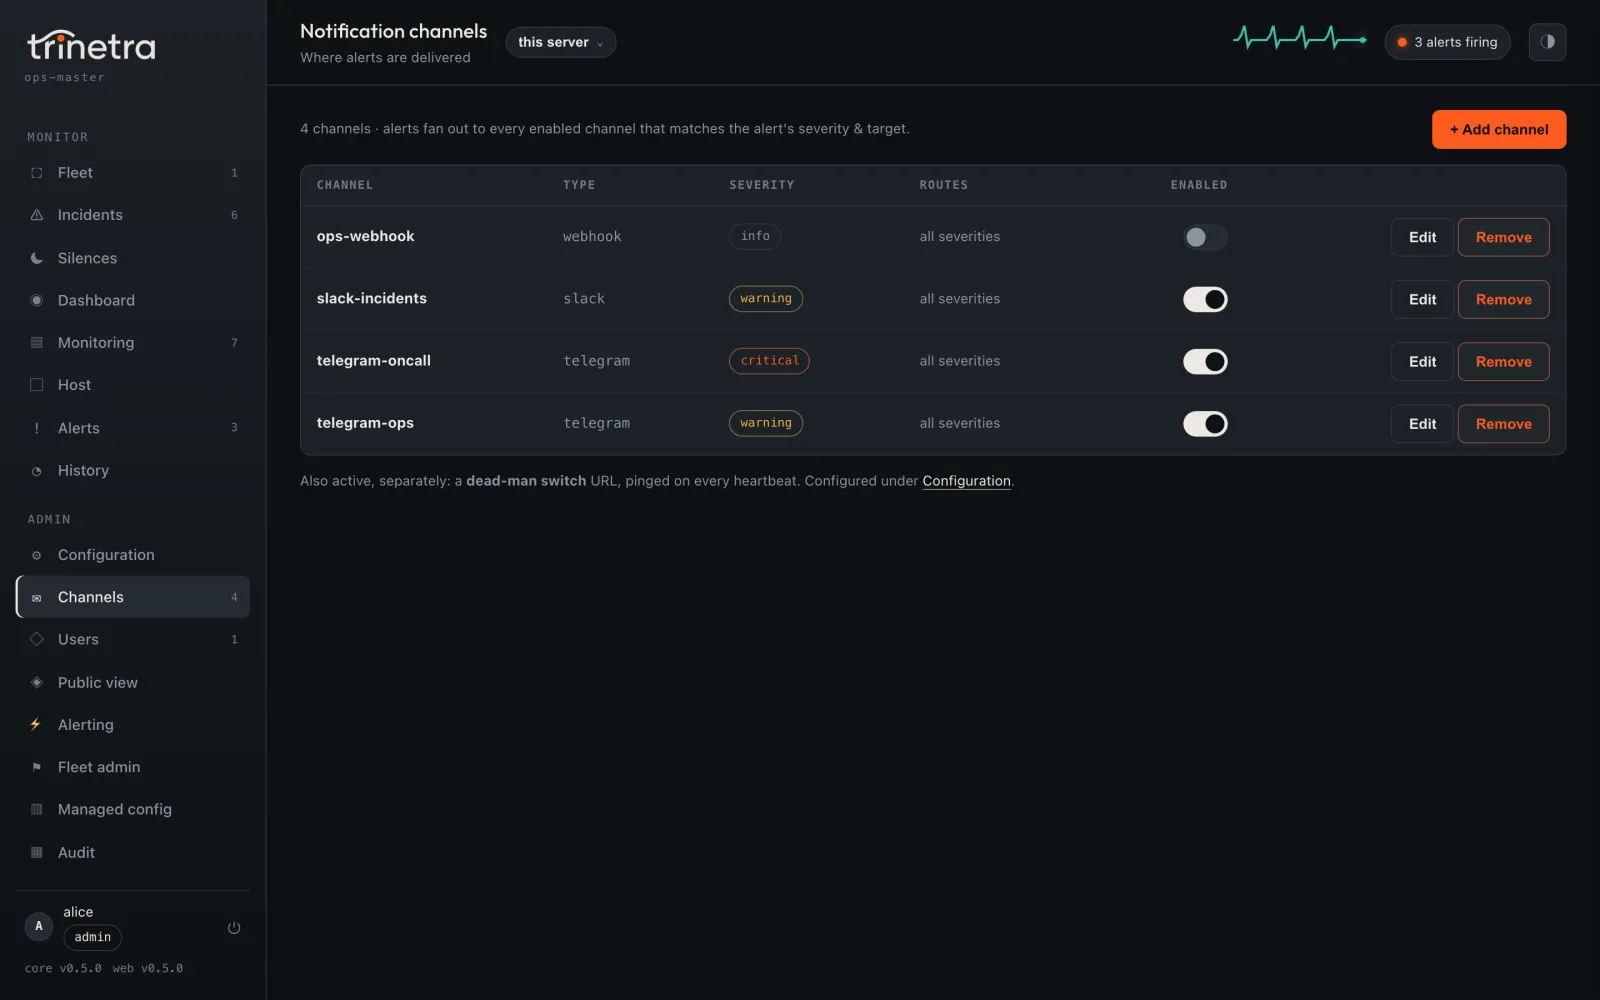
| Channel | What it needs |
|---|---|
| Telegram | A bot token from @BotFather. The bot also answers /stats, history and controls. |
| An SMTP host, a sender and recipients | |
| Slack, Discord | An incoming-webhook URL |
| ntfy | A topic, on ntfy.sh or your own server |
| Gotify | A server and an application token |
| Webhook | A URL, and a Go template if the receiver wants its own JSON |
A dead-man switch on healthchecks.io can alert you while the box itself is off, which nothing on the box can do.
Make one host the master and enroll the rest with a join code. The code pins the master’s certificate authority, so a child never trusts on first use, and from then on every child talks to the master over mutual TLS.
# on the master
sudo trinetra fleet init --address monitor.example.com
sudo systemctl restart trinetra
sudo trinetra fleet token create --tags prod --uses 3

# on each server, with the code the master printed
sudo trinetra fleet join swj1_...
sudo systemctl restart trinetraA child keeps monitoring, storing and alerting exactly as it did alone. It also ships a copy of its history to the master through an outbox on disk, so an outage only delays the copy.
Online, lagging, down and revoked counts, a heatmap you can switch between CPU, memory, disk and load, top-five lists and link health. Ctrl-K or ⌘-K opens any child's full dashboard from the master's copy of its data.
Alerts from across the fleet are grouped into incidents. Each one has a timeline of what fired, who was told, what was held back and why. The same trail prints on the command line with trinetra fleet explain.
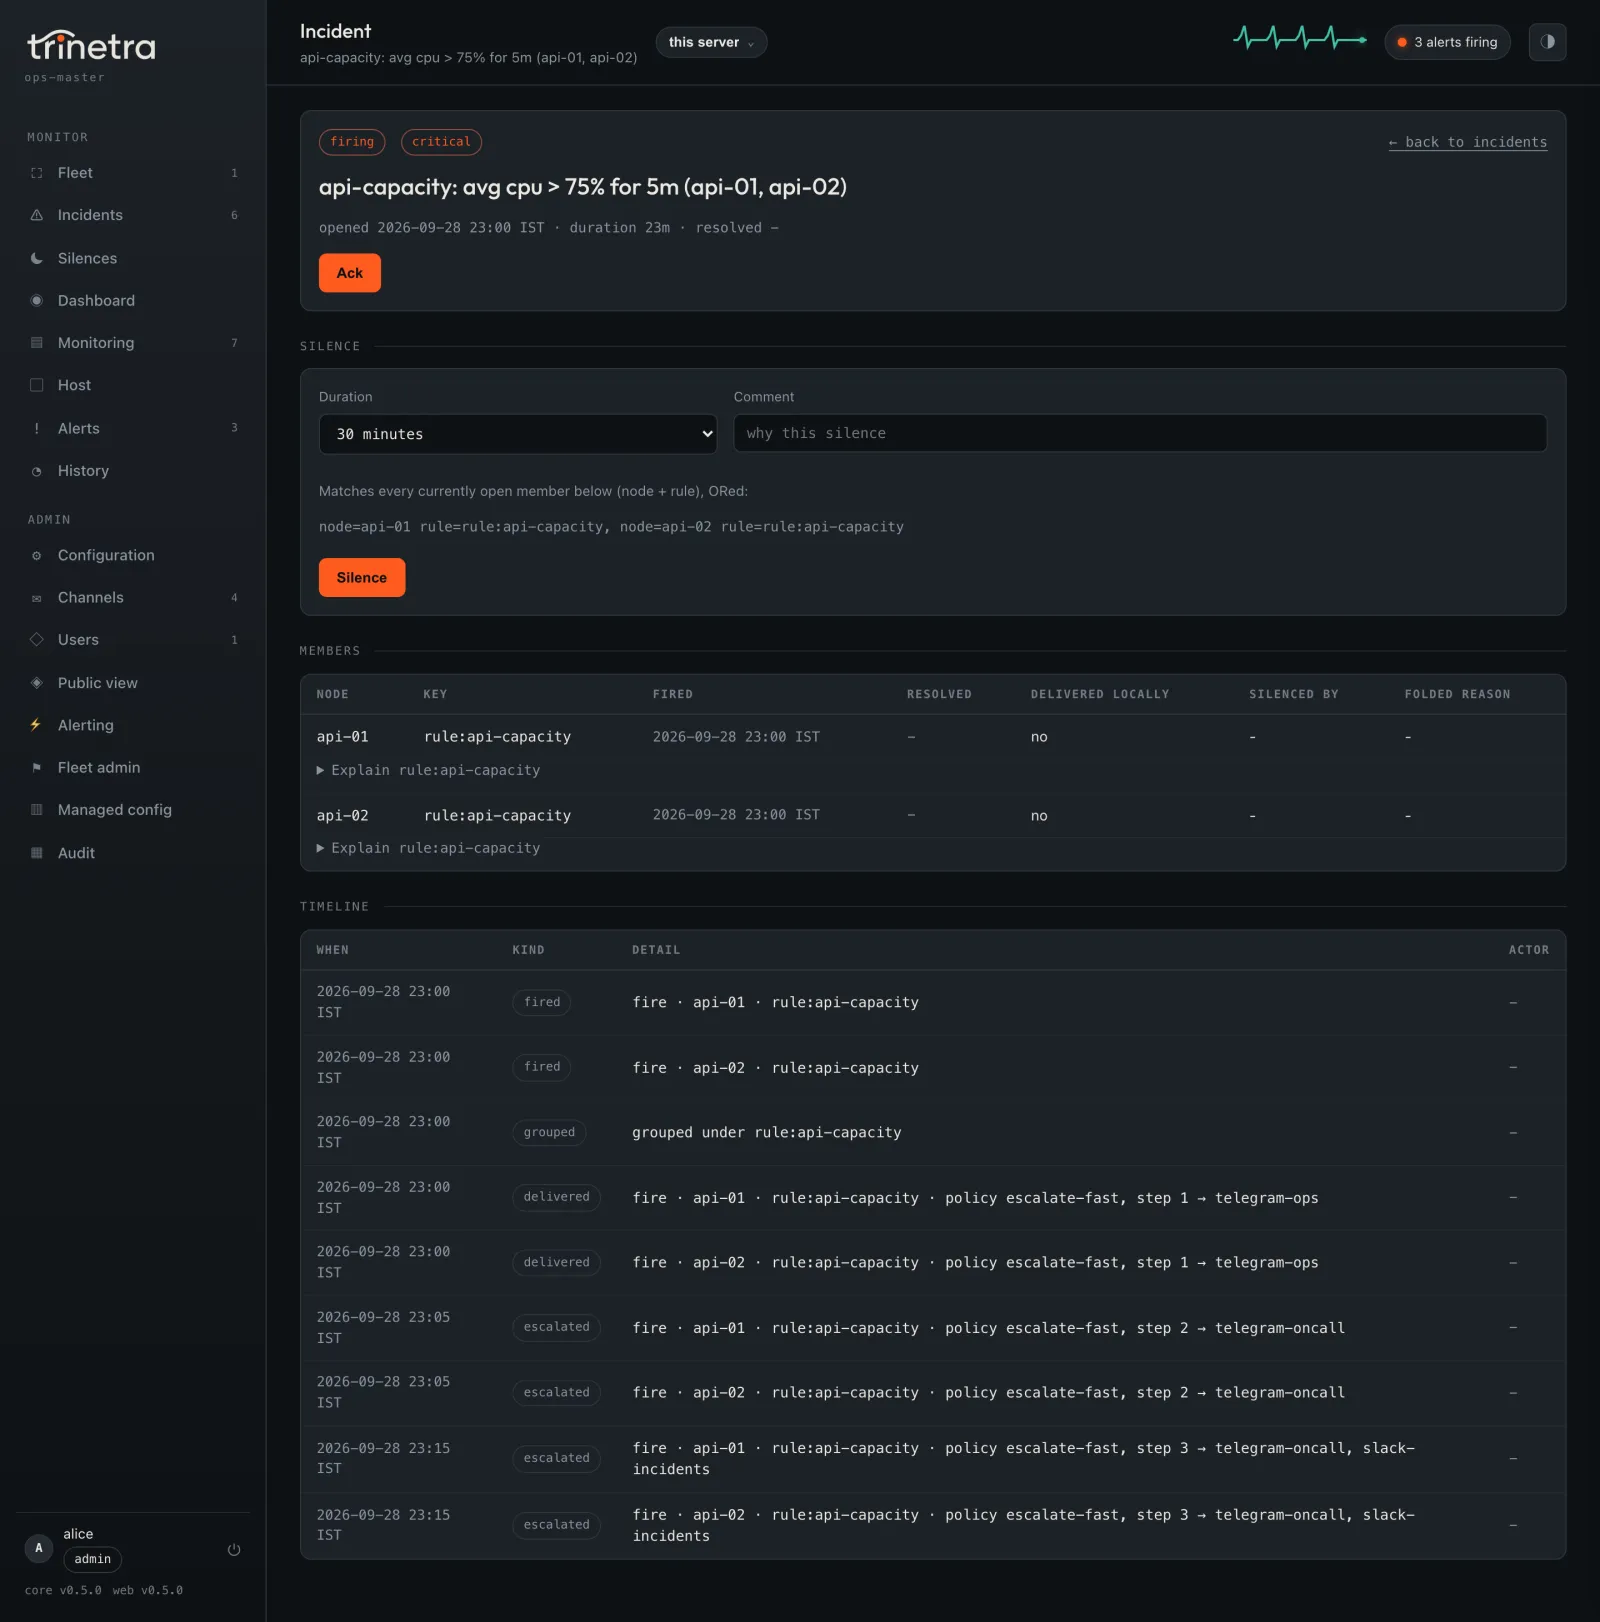
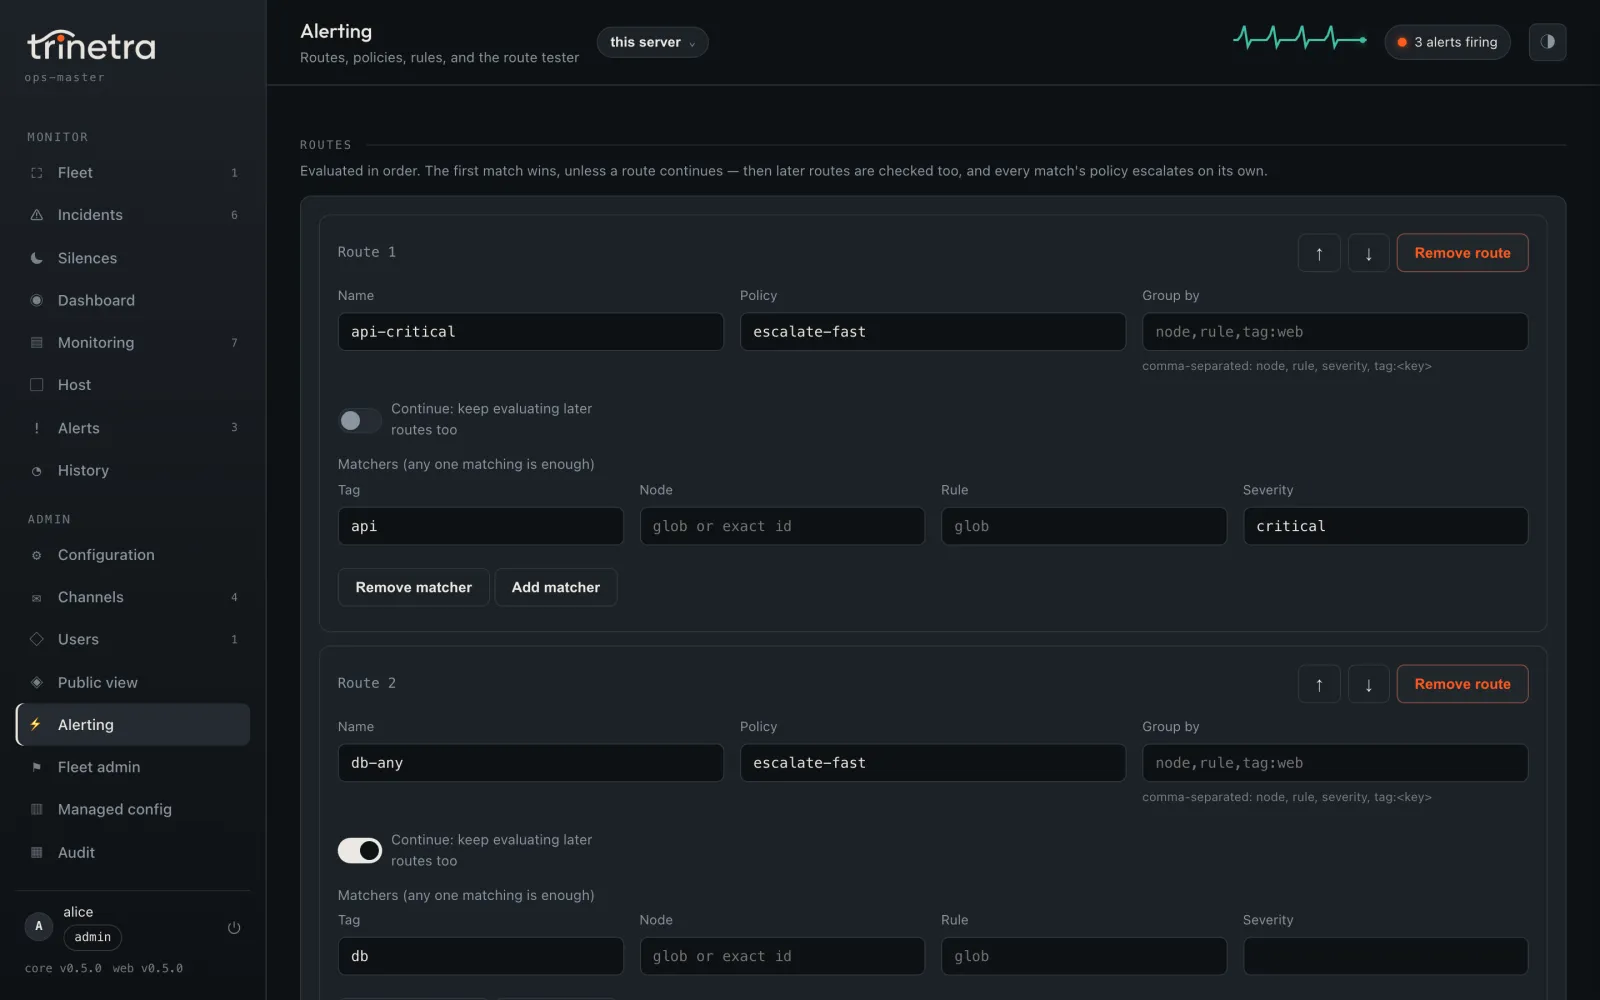
Routes match on tag, node, rule and severity and hand an incident to a policy: the ops chat now, on-call after five minutes, everyone after fifteen. The route tester answers where a made-up alert would go.
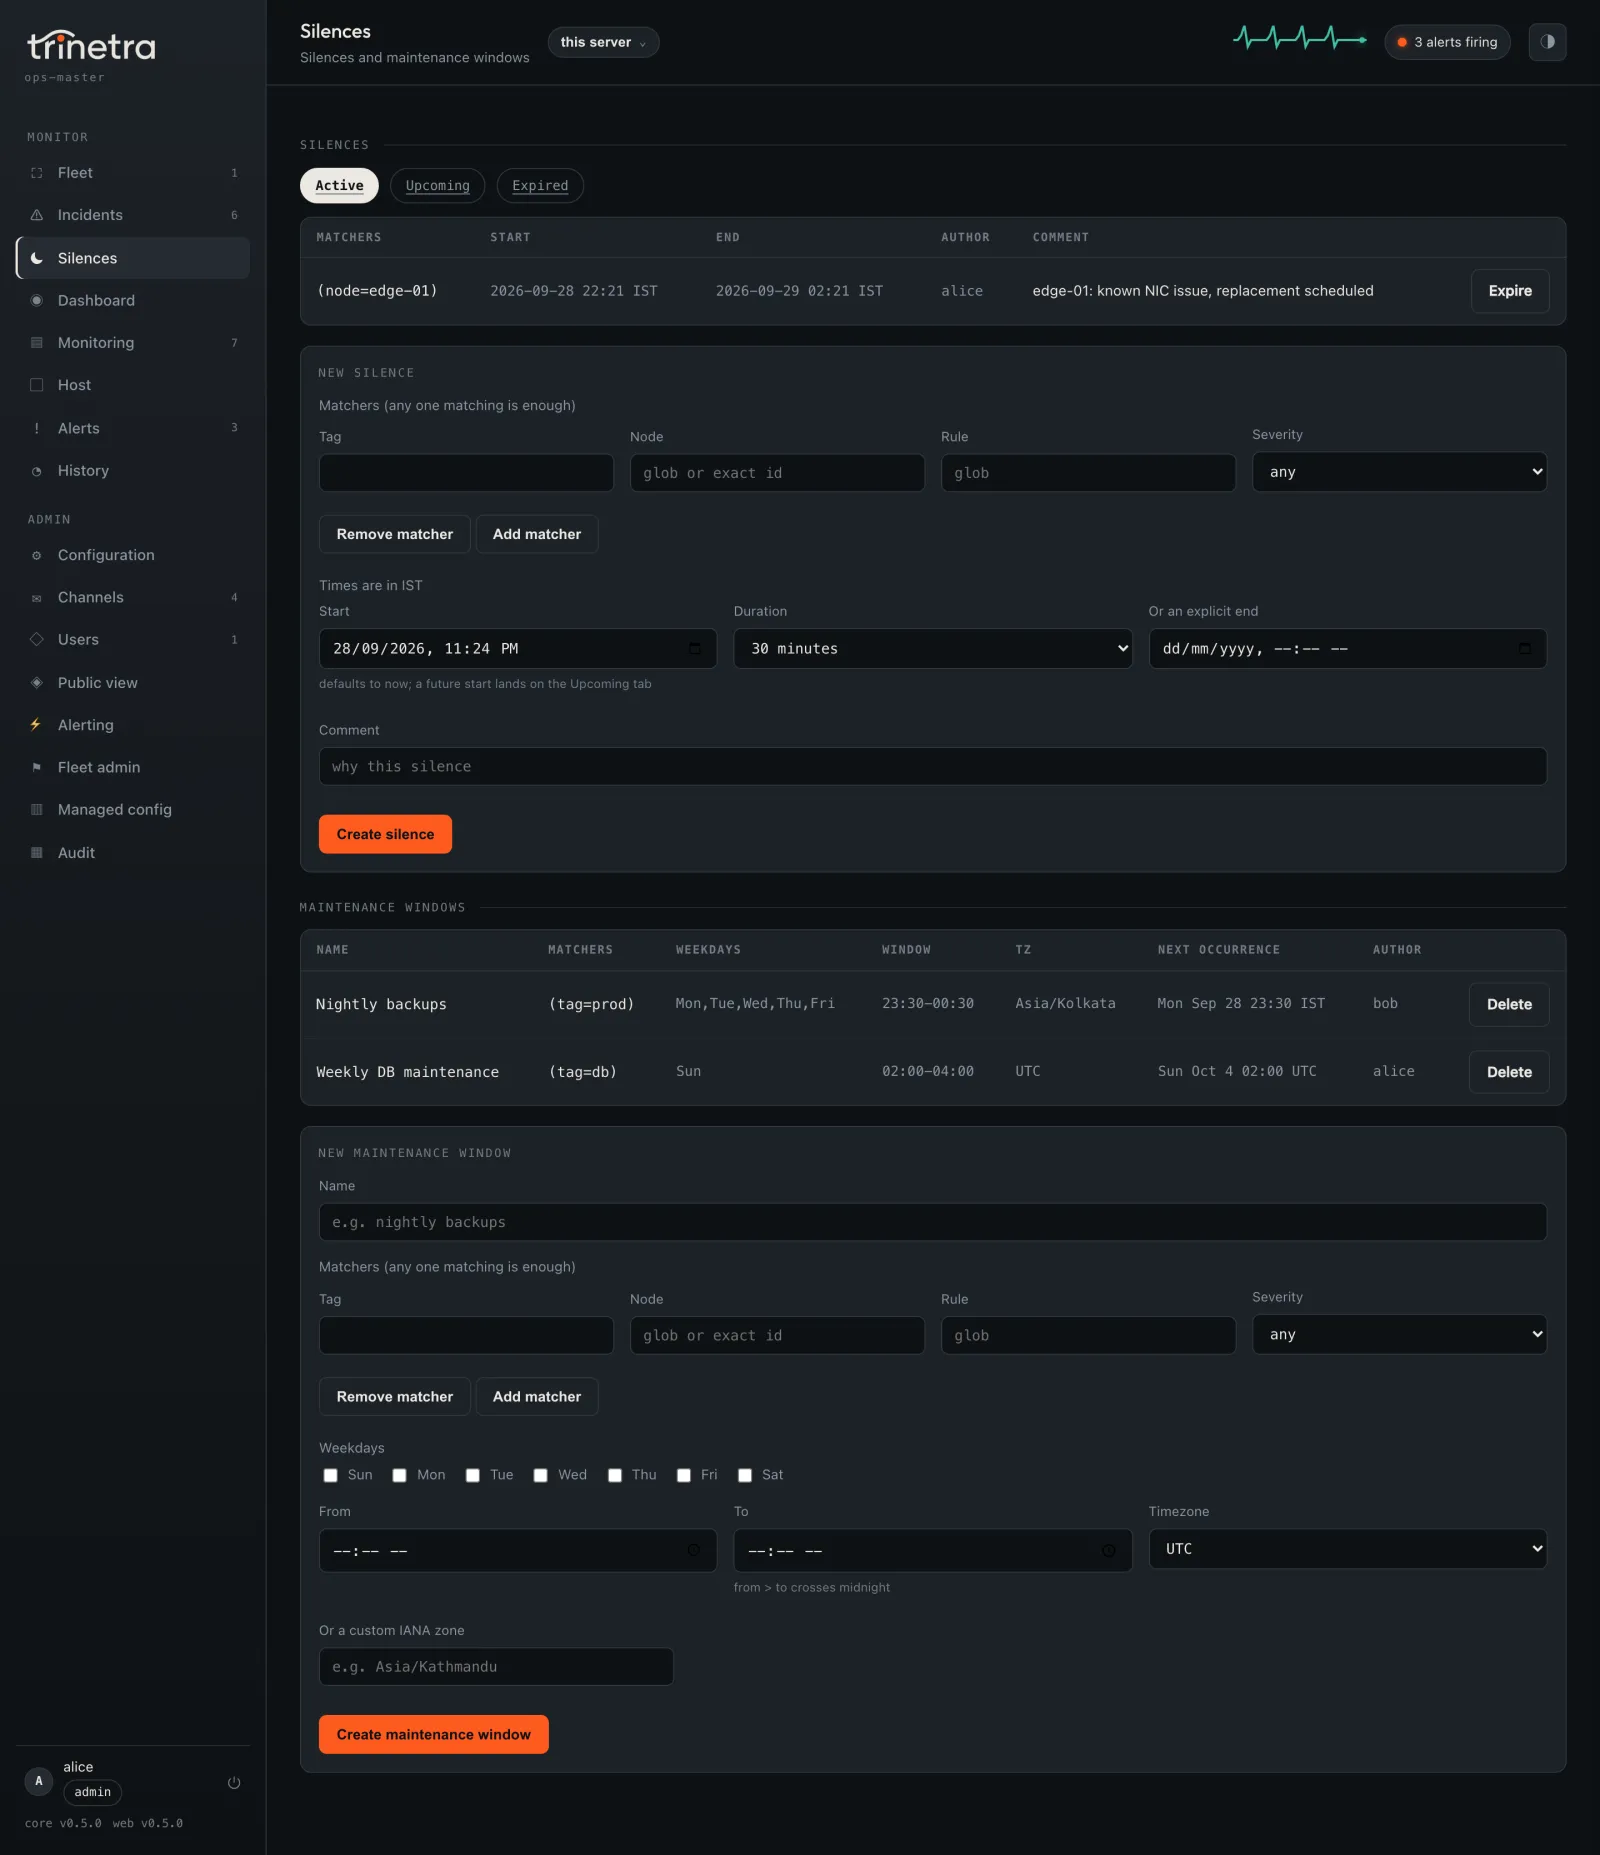
One-off silences by node, tag, rule or severity, and maintenance windows that recur by weekday in a named time zone. They are pushed to every child, so a child delivering on its own during an outage still honours them.
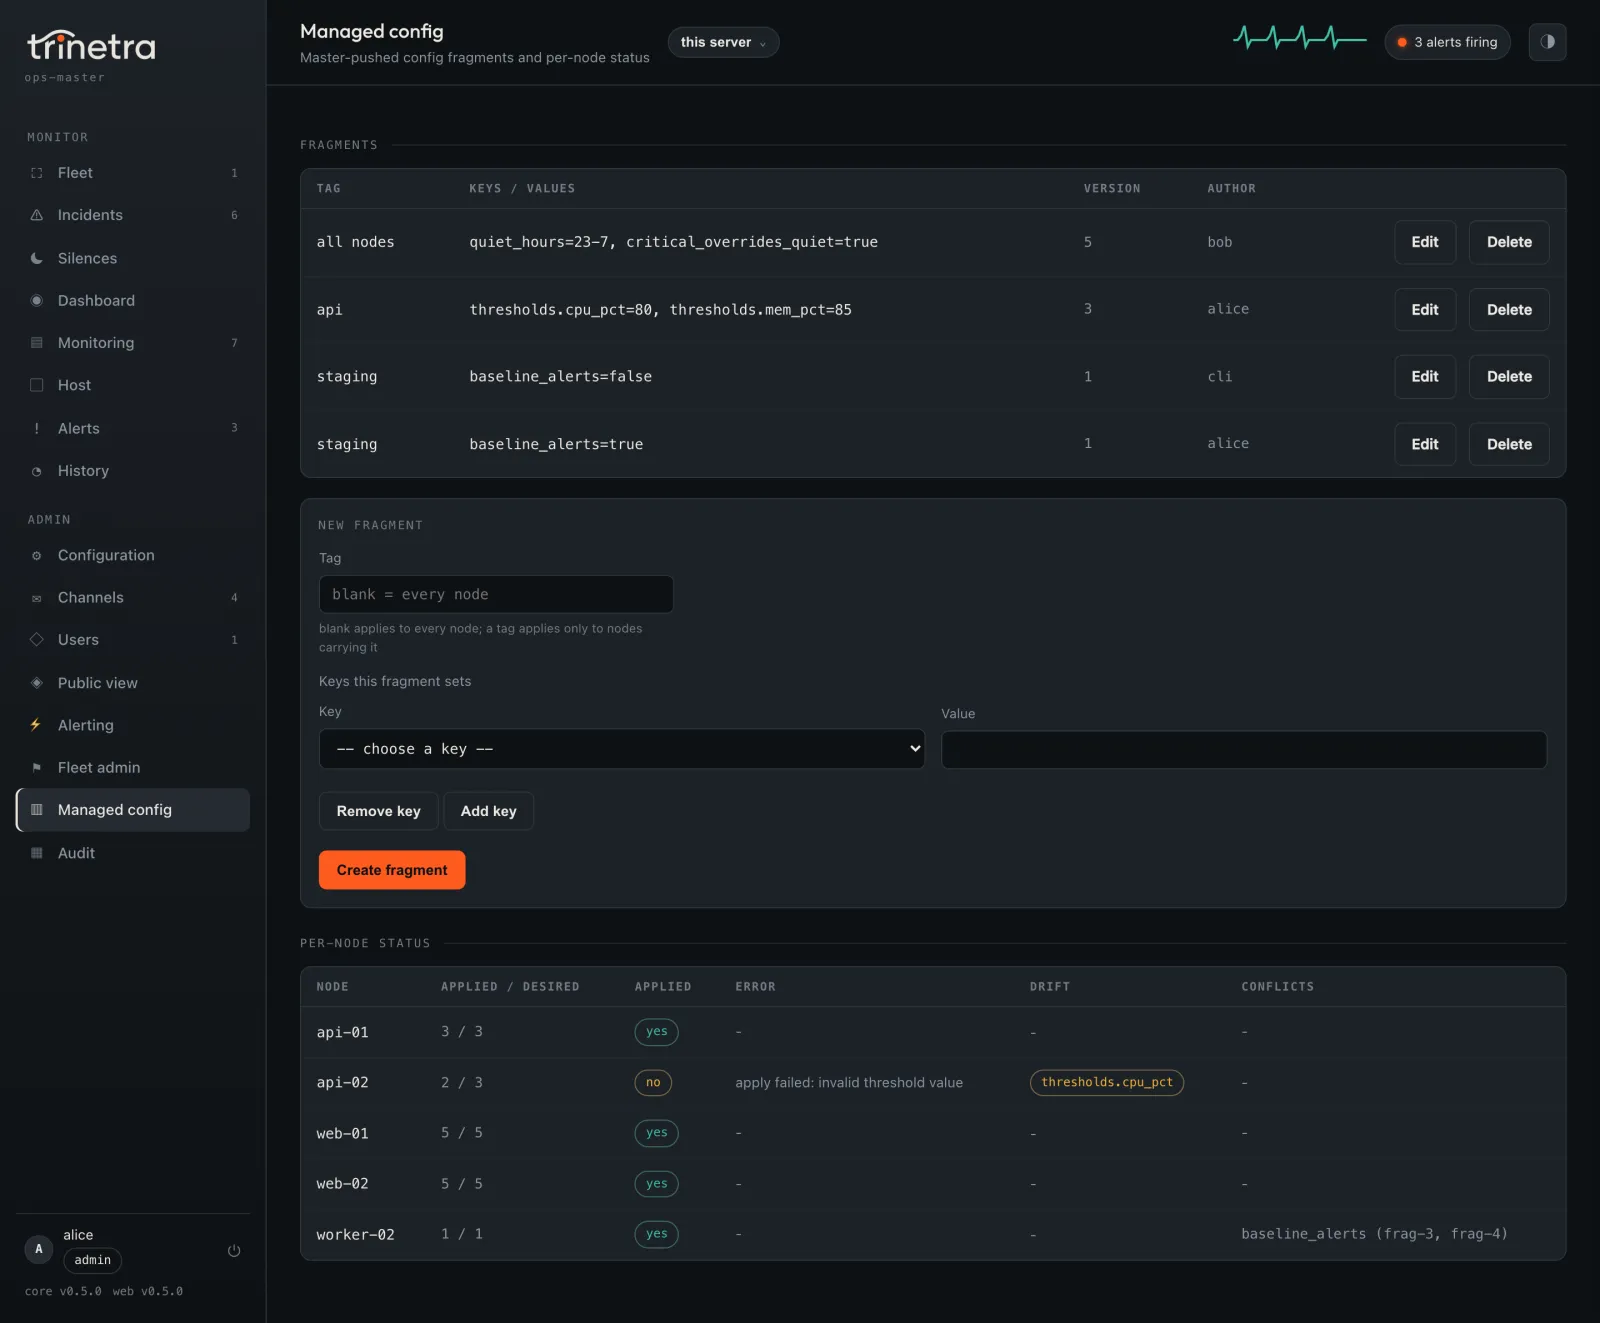
The master pushes thresholds, quiet hours and baseline settings to every node with a tag. Each node reports what it applied, and drift or a conflict shows up against its name.
Alert on a tier as a whole with a small grammar that is not PromQL. The master checks every rule every 30 seconds against each node’s replica.
avg(tag:api, cpu) > 75 for 5m            # the api tier is running hot
online(tag:prod) < 8 for 2m              # lost production capacity
absent(tag:staging, 10m)                 # staging went quiet
count(tag:web, disk > 90) >= 1 for 5m # any web node nearly fullEvery release ships a manifest of exact file hashes, signed by the build pipeline and co-signed offline by a maintainer. A host checks both against keys compiled into the binary it is already running, and treats GitHub and the network as untrusted transport.
trinetra update apply restarts under a guard. If the new daemon is not healthy within 90 seconds, it goes back to the build that was. You can also check a download by hand with sha256sum and OpenSSL, without trusting Trinetra at all.
$ sudo trinetra update applyInstalled and confirmedStaged, smoke-tested, swapped in, restarted, and confirmed healthy. The version floor moves up to it.
Heavy features are separate programs. The web UI and the terminal UI talk to the daemon over a local socket, so their dependencies never reach it, and each runs only if you install it.
Measured on Linux containers with 8 vCPUs over about 72 minutes, sampling every 10 seconds, six times the default rate. A default install is lighter still.
| Core daemon | 11.8 MB static on amd64, 10.9 MB on arm644.3 to 4.7 MB gzipped |
| Memory | 11.6 MB RSS on its own12.4 MB as a fleet child, 14.0 MB as a master with two children |
| CPU | About 0.4% of one core0.6% as a child, 1.2% as a master with two children |
| Disk | About 0.3 MB of history per hostafter the first hour, with tiered retention |
| Web UI plugin | 7.7 MB RSS, about 0.07% CPUand only when you turn it on |
| Third-party code in the core | Nonethe daemon is Go's standard library, enforced by a test |
Against the tools people most often run on a handful of Linux servers, from each project’s own docs as of September 2026. Where a vendor publishes no number, the table says so.
| Compared on | Trinetra | Netdata | Prometheus stack | Beszel | Uptime Kuma |
|---|---|---|---|---|---|
| What you run | One daemon per server | Agent per server, optional parents and cloud | Exporters, Prometheus, Alertmanager, Grafana | Agent per server and a hub | One server, checks from outside |
| Memory per host | 11.6 MB | 100–200 MB empty, 250–350 MB typical | Not documented | Not documented | No agent |
| Central server down | Every host still alerts | Agents still alert | Nothing fires | Nothing fires | Nothing fires |
| Incidents and escalation | Built in | In Netdata Cloud | With Alertmanager config | Per-metric alerts | Per-monitor alerts |
Pick Netdata for per-second metrics and anomaly detection, Prometheus for custom metrics and PromQL, Uptime Kuma for checking sites from outside, and Beszel if you need an MIT licence. The full comparison covers Zabbix and Datadog too, with sources.
Any Linux with systemd: Ubuntu, Debian, Raspberry Pi OS, Fedora, RHEL. Pick the architecture of the server, not of your laptop. The current release is Trinetra 0.5.0.
Servers, VMs and NUCs
mkdir -p ~/trinetra-download && cd ~/trinetra-download && arch=linux-amd64
for b in trinetra trinetra-ctl trinetra-web; do
  curl -fsSL -o "$b" "https://github.com/InfoDiveLabs/trinetra/releases/latest/download/$b-$arch"
done
for f in manifest.json manifest.ci.sig manifest.maint.sig; do
  curl -fsSL -o "$f" "https://github.com/InfoDiveLabs/trinetra/releases/latest/download/$f"
done
chmod +x trinetra trinetra-ctl trinetra-webRaspberry Pi 3, 4 and 5 on a 64-bit OS, ARM cloud servers
mkdir -p ~/trinetra-download && cd ~/trinetra-download && arch=linux-arm64
for b in trinetra trinetra-ctl trinetra-web; do
  curl -fsSL -o "$b" "https://github.com/InfoDiveLabs/trinetra/releases/latest/download/$b-$arch"
done
for f in manifest.json manifest.ci.sig manifest.maint.sig; do
  curl -fsSL -o "$f" "https://github.com/InfoDiveLabs/trinetra/releases/latest/download/$f"
done
chmod +x trinetra trinetra-ctl trinetra-webOlder 32-bit Raspberry Pi OS and ARMv7 boards
mkdir -p ~/trinetra-download && cd ~/trinetra-download && arch=linux-arm
for b in trinetra trinetra-ctl trinetra-web; do
  curl -fsSL -o "$b" "https://github.com/InfoDiveLabs/trinetra/releases/latest/download/$b-$arch"
done
for f in manifest.json manifest.ci.sig manifest.maint.sig; do
  curl -fsSL -o "$f" "https://github.com/InfoDiveLabs/trinetra/releases/latest/download/$f"
done
chmod +x trinetra trinetra-ctl trinetra-webRun this on the server and pick the tab it names.
uname -m
# x86_64   → x86-64
# aarch64  → ARM64
# armv7l → ARMv7sudo ./trinetra install --require-signed
sudo trinetra cliinstall checks both signatures and every hash, refuses on any mismatch, then installs the daemon and whichever plugins sit beside it and starts the systemd service. cli walks you through the Telegram bot token and turning on the web UI.
The one required setting is the bot token. Send the bot /start with the PIN it prints, and it answers only you. Then send /stats.
The docs cover the web UI, channels, fleets, updates and upgrading from serverwatch.
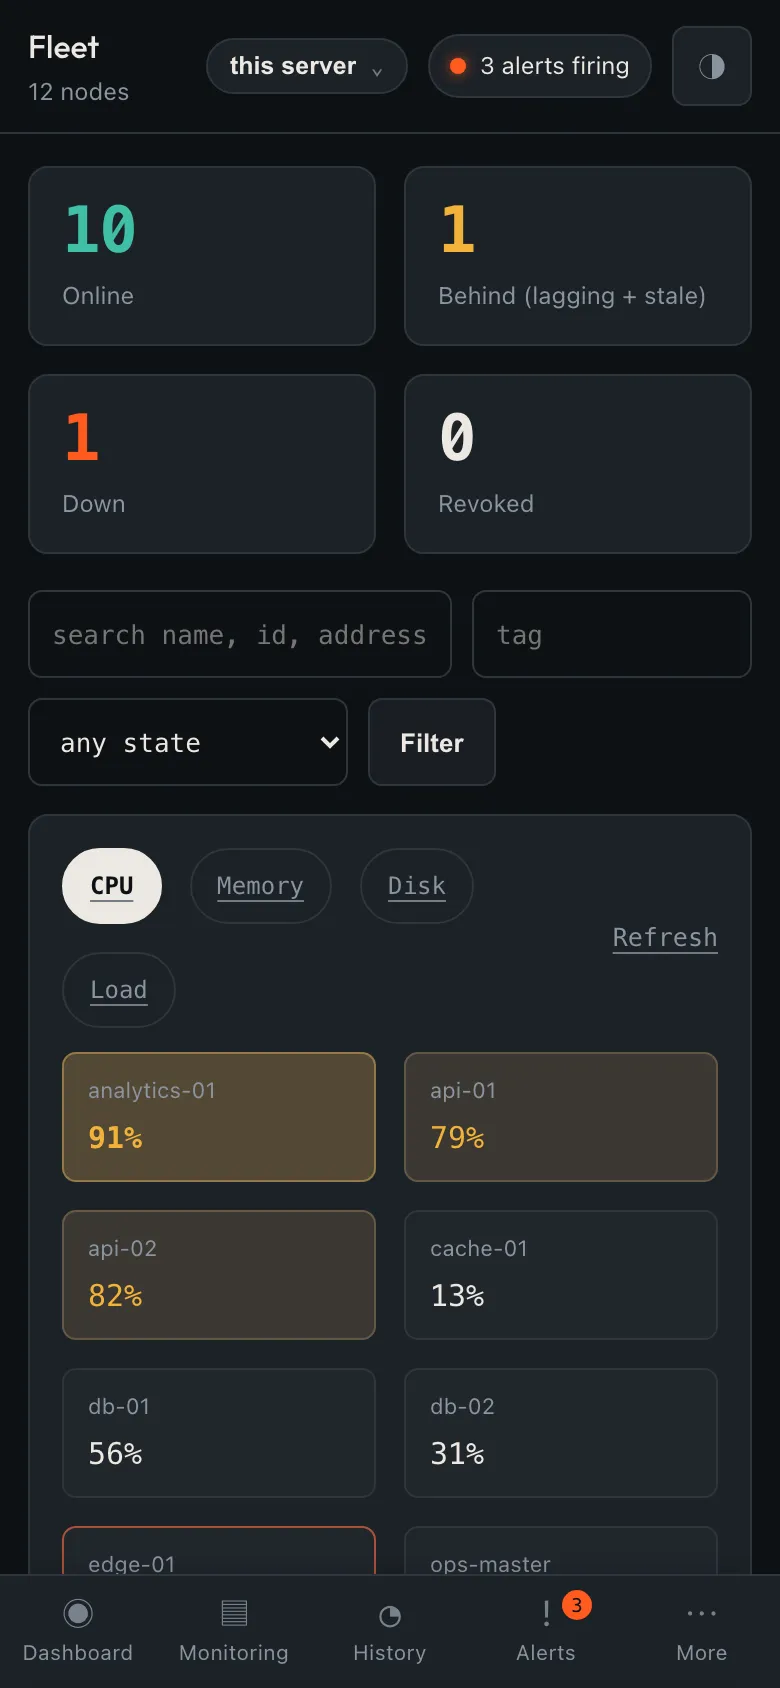
Light and dark themes, an icon rail on a tablet and a bottom tab bar on a phone. Sign in with a passkey: Touch ID, Windows Hello or a security key. There are no passwords.
Written down so nobody has to find out.
trinetra channel test.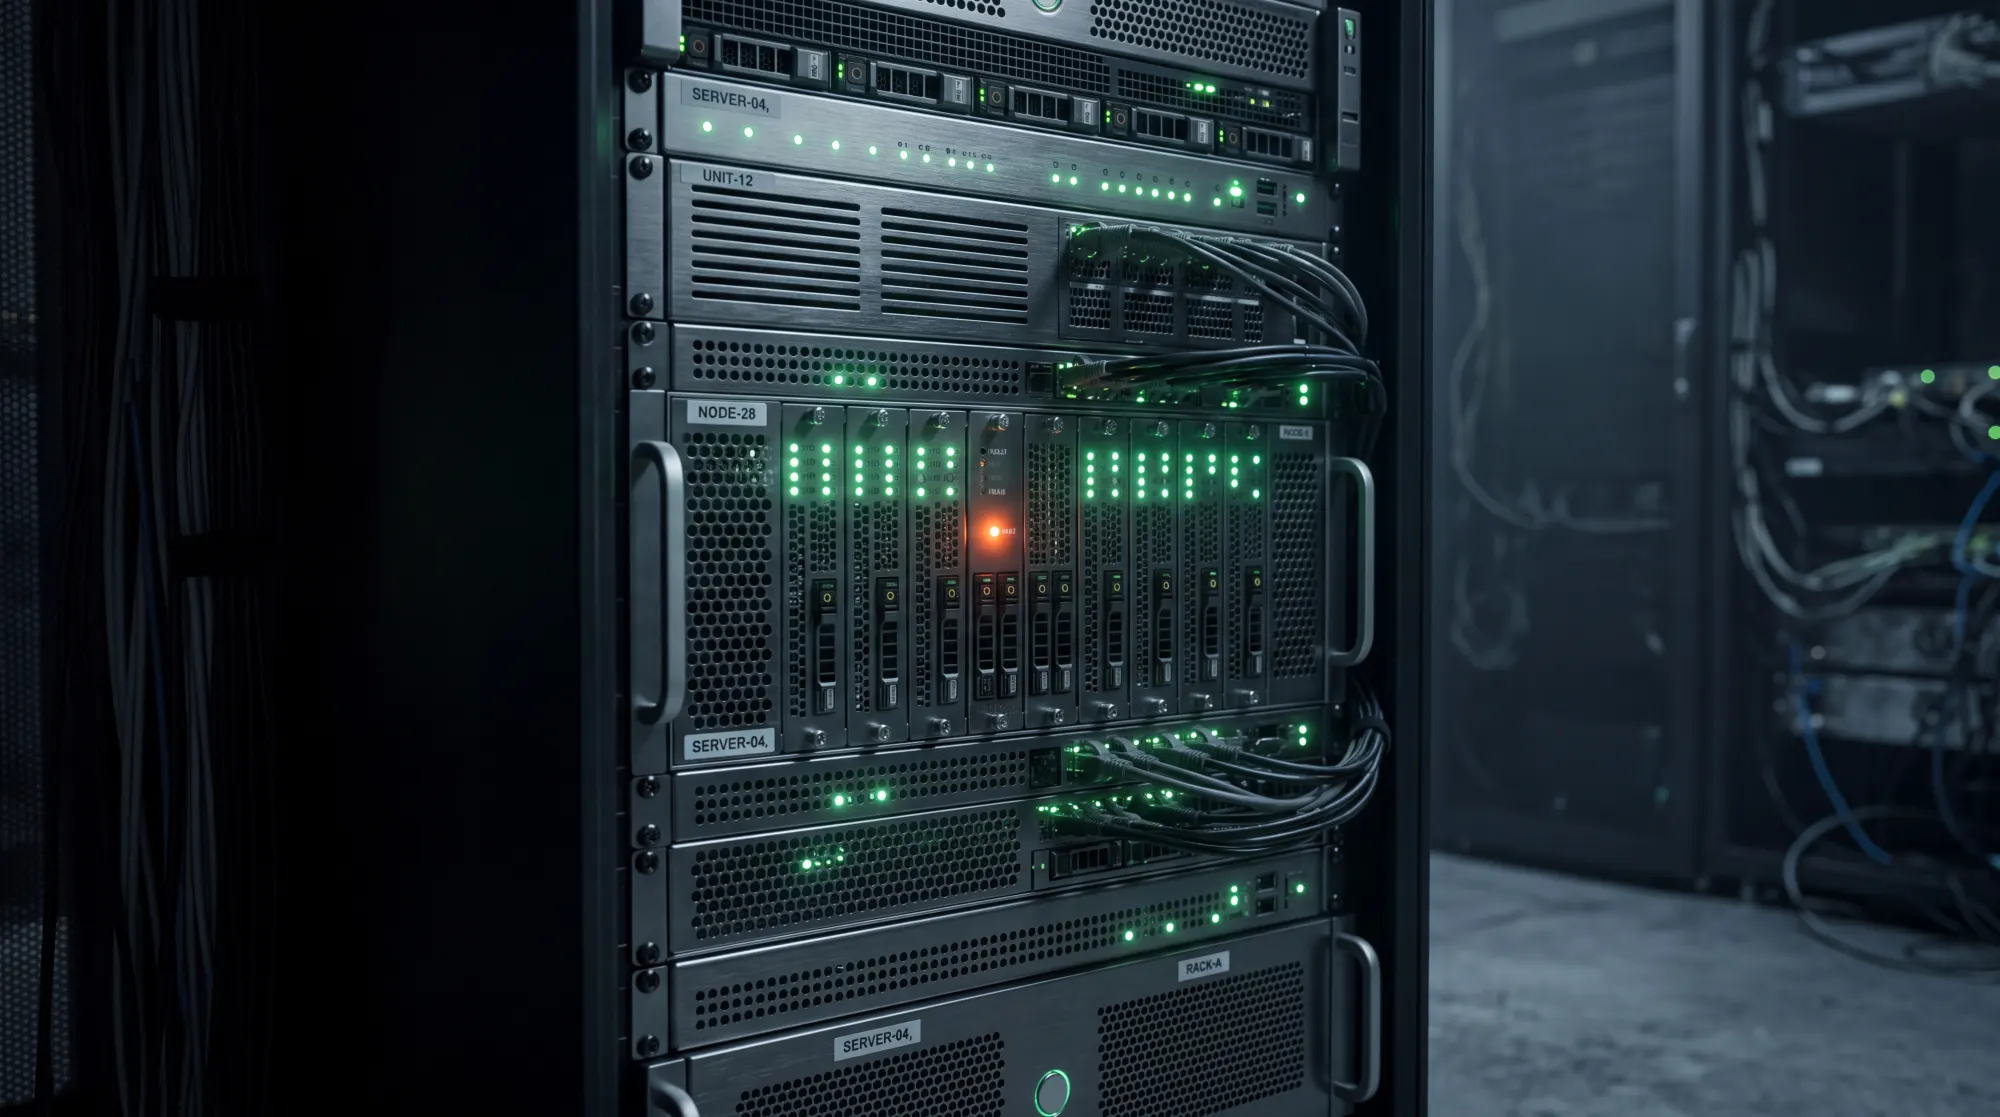
One light is on. Trinetra already told you which one.