Netdata and Trinetra both monitor Linux servers from an agent on each box, both can centralise a fleet on one node, and both are self-hosted. They are built around different questions. Netdata asks how much you can see about every server, every second. Trinetra asks when you should be told, and makes sure the answer still arrives when the box in the middle is gone. If you need per-second metrics, machine-learning anomaly detection or proven scale to hundreds of nodes, pick Netdata. If you need a fleet that pages you once per problem, keeps paging when the central node dies, and costs nothing per node, pick Trinetra.
We build and run Trinetra, so read this with that in mind. Every Netdata figure below comes from Netdata's own documentation, repository or pricing page, checked in October 2026, and we link each one. Where Netdata is better, we say so.
Key takeaways
- Where the alert is decided is the biggest difference. Netdata's documented best practice evaluates alerts on the parent; Trinetra evaluates them on every host and lets the master group, route and escalate.
- When the central node dies, a Trinetra child delivers its own alert after two minutes. In Netdata's recommended central setup, a child's metrics cannot alert until the parent returns.
- Depth goes to Netdata: per-second collection, two years of tiered history and anomaly detection on the agent. Trinetra samples every 5 and 60 seconds and keeps 30 days.
- Weight goes to Trinetra: 11.6 MB of memory against Netdata's documented 100 to 350 MB, with the caveat that Netdata collects far more.
- Cost: Trinetra is free to self-host at any size. Netdata's agent is free, but for a business fleet past five nodes the realistic path is the Business plan at $4.50 per node per month.
- Scale: Netdata is proven on large fleets. Trinetra has no published benchmark beyond a master with two children.
The short version
| Netdata | Trinetra | |
|---|---|---|
| Built for | Seeing everything, every second | Deciding when to page you |
| Collection | Per second | Every 5 s (CPU, memory, load) and 60 s (disks, containers, services) |
| Default history per host | 14 days at 1 s, 3 months at 1 min, 2 years at 1 h | 48 hours raw, 30 days of 1-minute rollups |
| Memory per host | 100 to 200 MB empty, 250 to 350 MB typical | 11.6 MB standalone, 12.4 MB as a fleet child |
| Fleet hub | Parents, plus Netdata Cloud | A master, one command away |
| Alerts evaluated | On each agent, or on parents (recommended for large setups) | On every host, always |
| Central node down | Recommended setup: children cannot alert | Children deliver their own alerts after 2 minutes |
| Incidents, routing, escalation | Notifications via Cloud; escalation through PagerDuty and similar | Built in |
| Public status page | No | Yes |
| Anomaly detection | ML on the agent, 18 models per metric | No; thresholds and a per-host baseline |
| Windows | Yes | No, Linux with systemd only |
| Licence | Agent GPL-3.0+, dashboard UI under the proprietary NCUL1 | FSL-1.1-ALv2, Apache-2.0 after two years |
| Cost for a business fleet | Business plan, $4.50 per node a month billed yearly | Free |
Where the alert decision is made
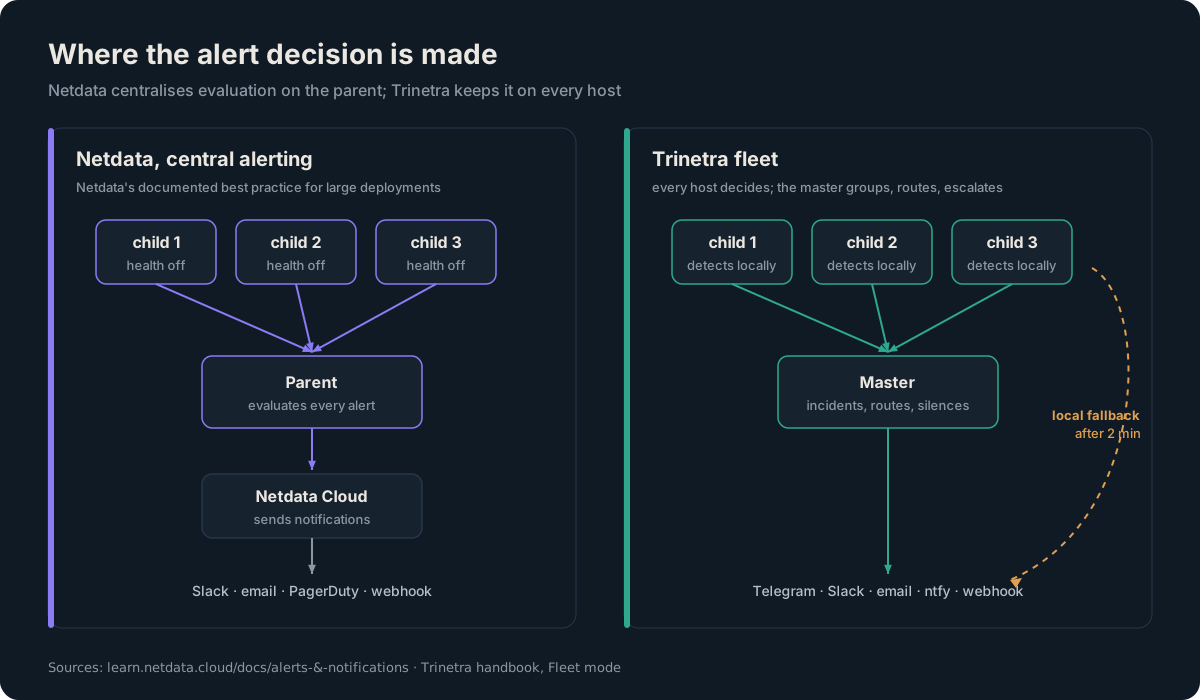
Both tools put an agent on every server. What differs is who decides that something is wrong.
A Netdata agent evaluates its own alerts by default. In a fleet, children stream their metrics to a parent, and the parent evaluates its own alerts on what it receives; streaming does not carry alert state across. That gives you two sets of alerts for the same metrics, so for large deployments Netdata's alerting documentation recommends four steps: disable health monitoring on child nodes, share one alert configuration across parents, disable parent notifications, and keep only Netdata Cloud notifications. Evaluation moves to the parent and delivery moves to the Cloud.
A Trinetra child always detects its own alerts, exactly as it would on its own. What fleet mode changes is delivery. While the child holds a lease from the master, renewed every 30 seconds, it hands each firing alert to the master, which runs it through silences, grouping, routing and escalation. If the master has not confirmed delivery within two minutes, or the lease has expired, the child sends the alert itself, marked via local fallback: master unreachable. The master deduplicates, so the alert arrives once either way.
What happens when the central node dies
This is where the design choice shows up in practice.
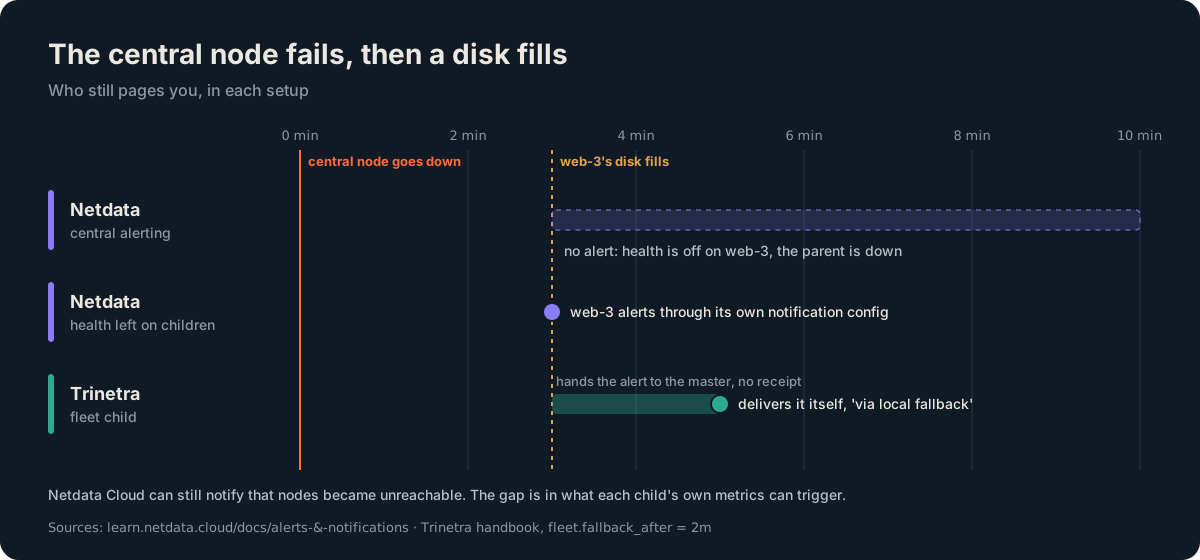
Take a parent or master that loses power, and three minutes later a disk filling on web-3:
- Netdata, central alerting as documented. Health is off on
web-3, and the parent that would have evaluated its metrics is down. Nothing fires for that disk until the parent is back. Netdata Cloud does send reachability notifications, so you can still learn that nodes went unreachable. - Netdata, health left on children.
web-3evaluates its own alerts and notifies through its own configuration. You avoid the silent gap, and you take on duplicate alerts and per-node notification settings in normal operation, which is what the best practice exists to avoid. - Trinetra.
web-3detects the disk, offers the alert to the master, gets no receipt and delivers it itself two minutes later. If the master is away for ten minutes, the child also warns locally that its fleet link is down.
Neither design is free. Netdata's approach gives you one place to manage alert rules across hundreds of nodes. Trinetra's gives every node a guarantee that it will still page someone, at the cost of every node needing working channel settings as a backstop.
How heavy is each agent
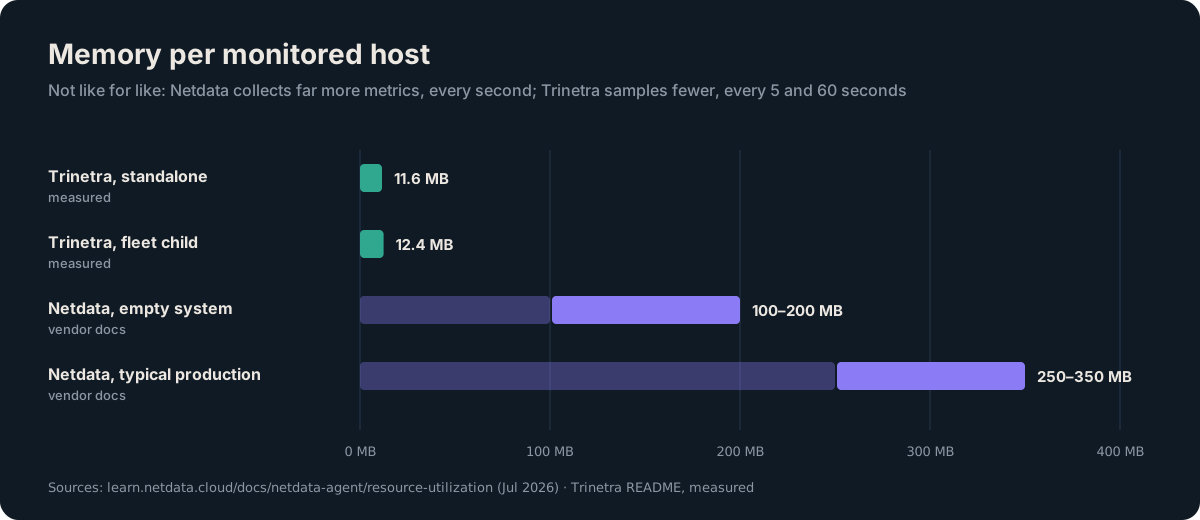
Netdata's resource utilization page, last updated in July 2026, documents 1% to 5% of a single core with default settings (5% to 20% in production), 100 to 200 MB of RAM on an empty system and 250 to 350 MB in typical production, and about 4 GiB of disk by default. Its anomaly detection adds about 18 KB of RAM per metric and, by Netdata's own account, typically doubles the agent's CPU use, from about 2% to about 4% of a core.
We measured Trinetra on Linux containers with 8 vCPUs over about 72 minutes, sampling six times faster than the default: 11.6 MB of memory standalone, 12.4 MB as a fleet child and 14.0 MB as a master with two children, about 0.4% of one core, and about 0.3 MB of history per host after the first hour.
This is not a like-for-like comparison and it would be dishonest to present it as one. Netdata is collecting far more metrics, every second, and running models on them. The fair conclusion is narrower: if a monitor's footprint matters on small VPSes or Raspberry Pis, Trinetra is an order of magnitude lighter, because it does less.
How fine, and how far back
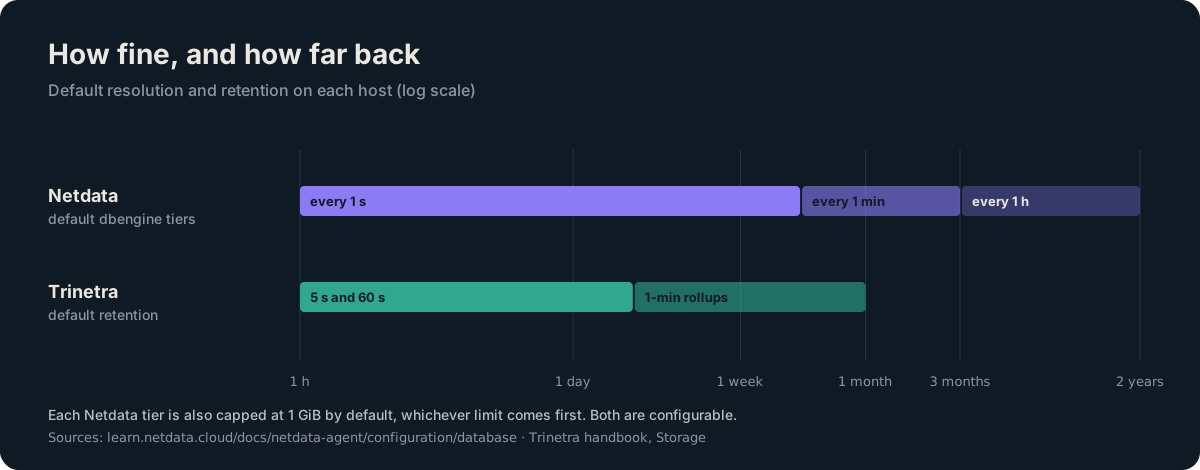
Netdata's database engine keeps three tiers by default: per-second data for 14 days, per-minute for 3 months and per-hour for 2 years, each also capped at 1 GiB, whichever limit comes first. That is a real advantage when you are chasing a spike that lasted four seconds, or comparing this month's load with last year's.
Trinetra keeps raw samples for 48 hours and one-minute rollups (min, average and max) for 30 days, plus downtime events for the same 30 days. Both retention windows are configurable. It is enough to answer "what happened overnight" and "was this disk filling all month", and not enough for capacity planning across seasons.
Fewer pages: incidents, routing and escalation
Netdata Cloud centralises notifications for a fleet: integrations such as Slack, Microsoft Teams, Amazon SNS, PagerDuty and Opsgenie, reachability notifications, and role-based access on paid plans. On-call rotations and escalation policies live in those integrations, such as PagerDuty, rather than in Netdata itself.
Trinetra builds the paging layer into the master:
- Incidents. Alerts with the same rule and severity share an incident, so ten web servers with the same full disk page you once. A node can declare what it depends on, and when the database is down, the API nodes that depend on it fold into its incident.
- Routes and escalation. Routes match on tag, node, rule and severity and hand an incident to a policy: the ops chat now, on-call after five minutes, everyone after fifteen. A route tester shows where a made-up alert would go before you save.
- Silences and maintenance windows, by node, tag, rule or severity, recurring by weekday in a named time zone, and pushed down to children so local fallback honours them.
- Fleet-wide rules in a small grammar that is not PromQL, such as
avg(tag:api, cpu) > 75 for 5moronline(tag:prod) < 8 for 2m. - A public status page with named services, 90-day uptime bars and incident updates, so customers see "Checkout: degraded" instead of a container name.
If your team already pays for PagerDuty and wants Netdata's depth, Netdata plus PagerDuty is a strong combination. If you would rather not buy an on-call product for a few dozen servers, Trinetra's master covers most of what a small team needs.
What it costs to run a fleet
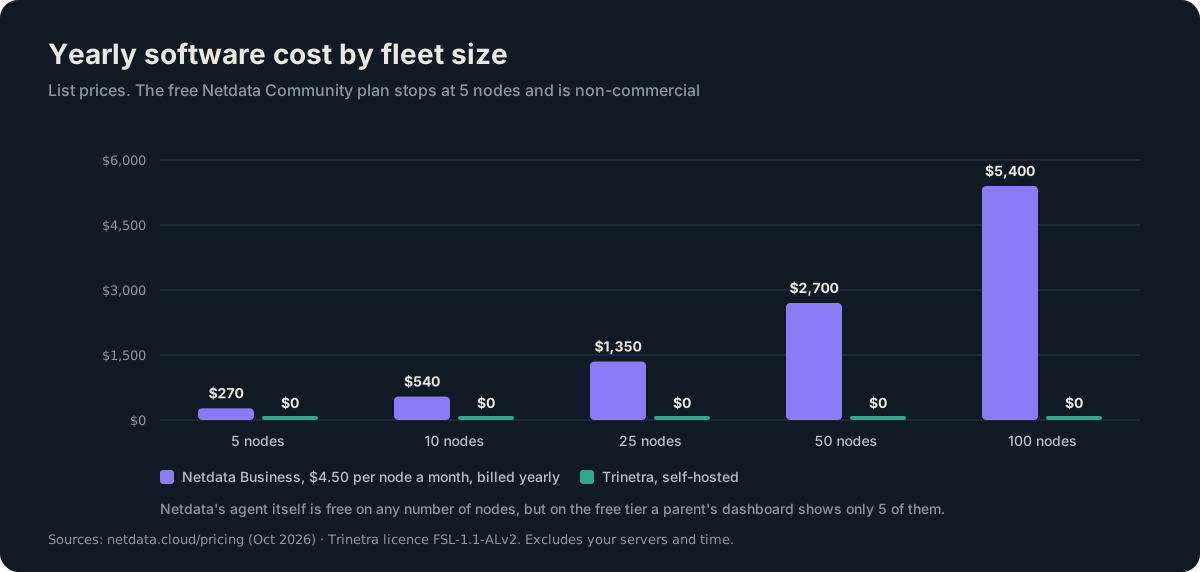
Netdata's pricing page lists three plans for organisations. Community is free, limited to 5 active nodes, one custom dashboard per room and non-commercial use. Business is $4.50 per node per month billed yearly ($540 a year for 10 nodes) with unlimited nodes, retention, RBAC, SSO and centralised configuration. Enterprise On-Premise starts at 200 node licences. A separate Homelab plan is $90 a year with no hard node limit, for personal, non-commercial use only.
The Netdata Agent itself is GPL-3.0 and free on any number of nodes, so you can run children and parents without Cloud. One catch: the dashboard bundled with the agent is licensed separately, under the proprietary Netdata Cloud UI License (NCUL1), and on the free tier a parent's local dashboard shows only five nodes. Netdata's founder explained in February 2025 that the Community limits had mistakenly not been applied to the agent dashboard before. In practice, a business with more than five servers that wants Netdata's fleet view pays per node.
Trinetra is free to self-host at any size, commercially too, under the Functional Source License with an Apache-2.0 future: you may not resell it as a competing product, and each release becomes Apache-2.0 two years after it ships. It is source-available, not open source in the OSI sense, and that matters to some teams.
Where Netdata is the better choice
- You troubleshoot with metrics. Per-second collection, with charts generated for everything it collects, is Netdata's core strength. Trinetra's charts answer "is it healthy", not "why is p99 latency up for four seconds every minute".
- You want anomaly detection. Netdata trains 18 models per metric on the agent and reaches steady-state accuracy after two to three days. Trinetra deliberately keeps a model out of the decision path.
- You run hundreds of nodes, or Windows. Netdata documents parent sizing for large fleets and ships a Windows agent. Trinetra is Linux with systemd only and has not published fleet-scale numbers.
- You need long history. Two years of hourly data by default against Trinetra's 30 days.
- You want an OSI open-source agent. Netdata's agent is GPL-3.0.
Where Trinetra is the better choice
- Every node must still page someone when the central node, its network or its power is gone.
- You want fewer, better pages without buying an on-call product: incidents, dependency folding, routes, escalation, silences and maintenance windows are built in.
- Footprint matters: 11.6 MB per host on small VPSes, Raspberry Pis or busy production boxes.
- You need a public status page fed by the same daemon that pages you.
- Per-node pricing does not fit a business fleet of a few dozen servers.
- You care how the monitor updates itself. Every Trinetra release is signed by the build pipeline and co-signed offline by a maintainer, and a failed update rolls itself back within 90 seconds.
What Trinetra does not do yet
Linux with systemd only, with no macOS or Windows builds. No custom application metrics and no Prometheus export. Network throughput is charted but nothing alerts on it. The terminal UI has no fleet screens. And, as above, no published benchmark past a master with two children. The roadmap is honest about all of it.
Running both
They do not conflict. Netdata's agent and Trinetra's daemon are separate processes with separate storage, and on most servers the combined footprint is still dominated by Netdata's. A reasonable split for a small team: Netdata for dashboards and troubleshooting, Trinetra for paging, incidents and the status page. If that sounds like one tool too many, start with the question you most need answered every day: "what is this server doing, second by second" points to Netdata, and "should I be woken up" points to Trinetra.
Try it
curl -fsSL https://www.infodivelabs.com/products/trinetra/install.sh | sudo sh
sudo trinetra cli
The installer picks the build for the server's architecture, verifies both release signatures and every file hash, and starts one systemd service. The product page has the manual steps, the full feature list and a comparison with Datadog, Prometheus, Zabbix and Uptime Kuma. The launch post explains how Trinetra decides when to alert.