
Most of the servers we look after are not in a data centre. They are a few VPSes, a database box, a Raspberry Pi running backups, a client's handful of machines in someone else's cloud. When we went looking for something to watch them, we found two camps, and neither fit. One was a monitoring stack built for companies with a platform team. The other was a service that would happily watch everything, for a monthly bill that grows with every server. Trinetra is what we built for the space in between. This post is why, with the numbers, and with the cases where you should ignore us and run Prometheus anyway.
Key takeaways
- The Prometheus stack is excellent and heavy: four projects, several config files and a single point of silence unless you double it.
- SaaS monitoring is easy to start and expensive to keep: ten servers on Datadog's Pro plans with APM cost $5,520 a year at list price, and your metrics live on someone else's infrastructure.
- Trinetra is one daemon per server. Storage, alert rules, incidents, a status page and the web UI live in the same binary, and every host keeps alerting if the central one dies.
- If you need custom application metrics, PromQL or Kubernetes, Prometheus is still the right tool.
The over-engineered nightmare: Prometheus, Grafana and Alertmanager
Setting this up for a small fleet of ten Linux servers is like building a space shuttle to drive across the street. Each piece is good at its job. There are just a lot of jobs.
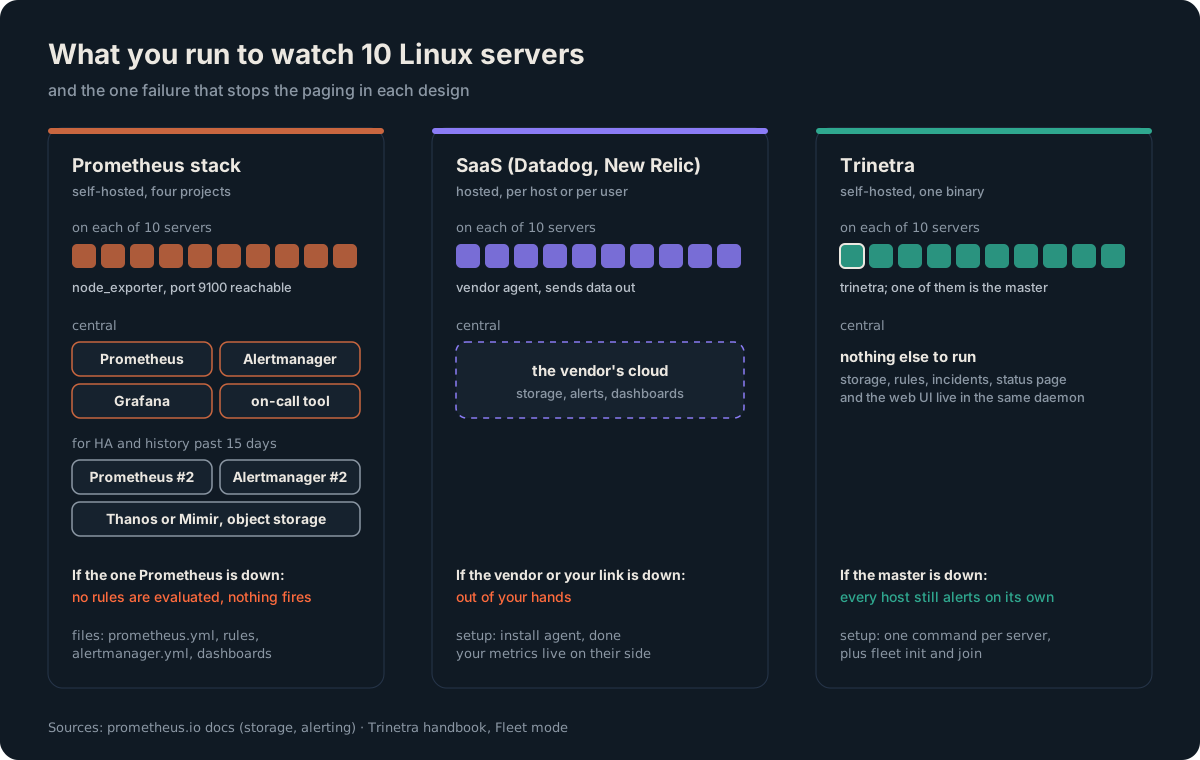
To get host metrics, dashboards and a message when something breaks, you run four projects:
- node_exporter on every server, exposing metrics over HTTP. Prometheus collects by pulling, so every one of those endpoints has to be reachable from the Prometheus host, and ideally not from anywhere else.
- Prometheus, which scrapes them, stores the time series and evaluates your alert rules. You write the scrape targets in
prometheus.ymland the rules in PromQL. - Alertmanager, a separate service that takes alerts from Prometheus and groups, inhibits, silences and routes them to receivers you define in
alertmanager.yml. - Grafana, to see anything. You add Prometheus as a data source and build dashboards, or import community ones and then maintain them.
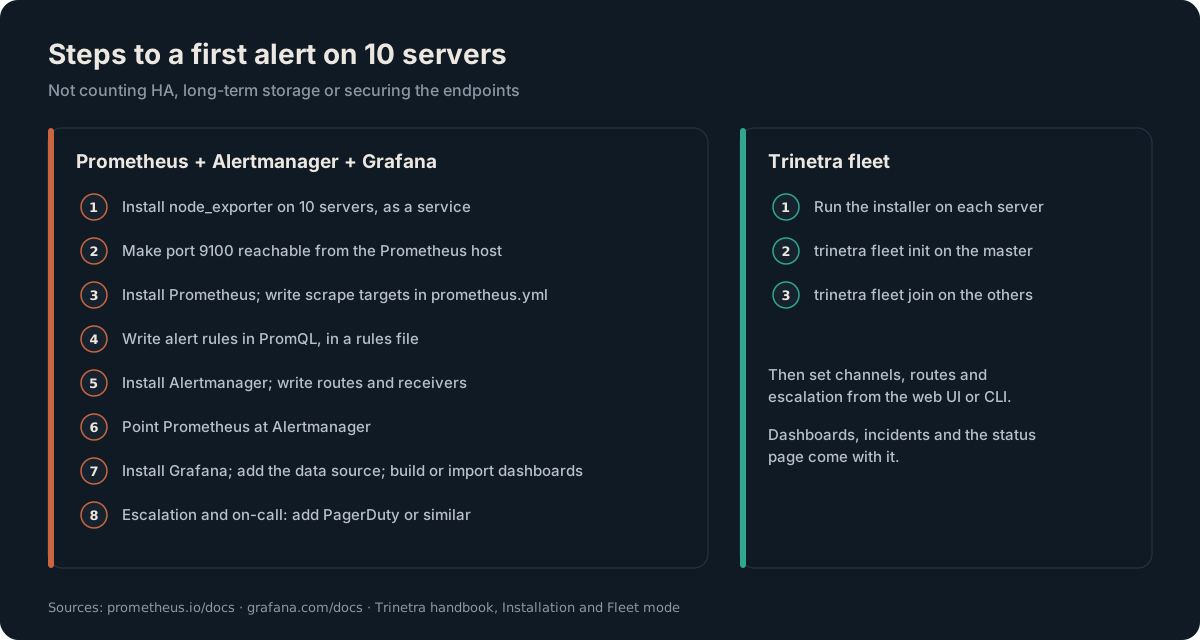
That gets you a first alert. It does not get you two things a small team needs just as much.
Something that still pages you when the monitor is the thing that broke. Alert rules are evaluated on the Prometheus server. With one Prometheus server, no rules run while it is down, so nothing fires. The documented answer is high availability: run two or more identical Prometheus servers and cluster Alertmanager, and point Prometheus at every Alertmanager rather than a load balancer. That doubles the parts you set out to keep small.
History and escalation. Local storage defaults to 15 days, and the docs are plain that it "is not clustered or replicated" and should be managed like any single-node database. Longer, durable history means remote write to something like Thanos or Mimir. Escalation and on-call schedules are not part of Alertmanager at all; it routes to tools like PagerDuty that do that. The open-source option many teams used, Grafana OnCall OSS, was archived in March 2026.
None of this is a flaw in Prometheus. It was designed for large, dynamic environments with people whose job is to run it, and there it is superb. For ten servers it is a lot of an engineer's time spent on the monitoring instead of the systems.
The wallet-bleeder SaaS: Datadog and New Relic
The hosted platforms fix the effort problem. Install an agent, and dashboards and alerts appear. They solve it by moving the cost to a monthly bill, and by moving your infrastructure data to theirs.
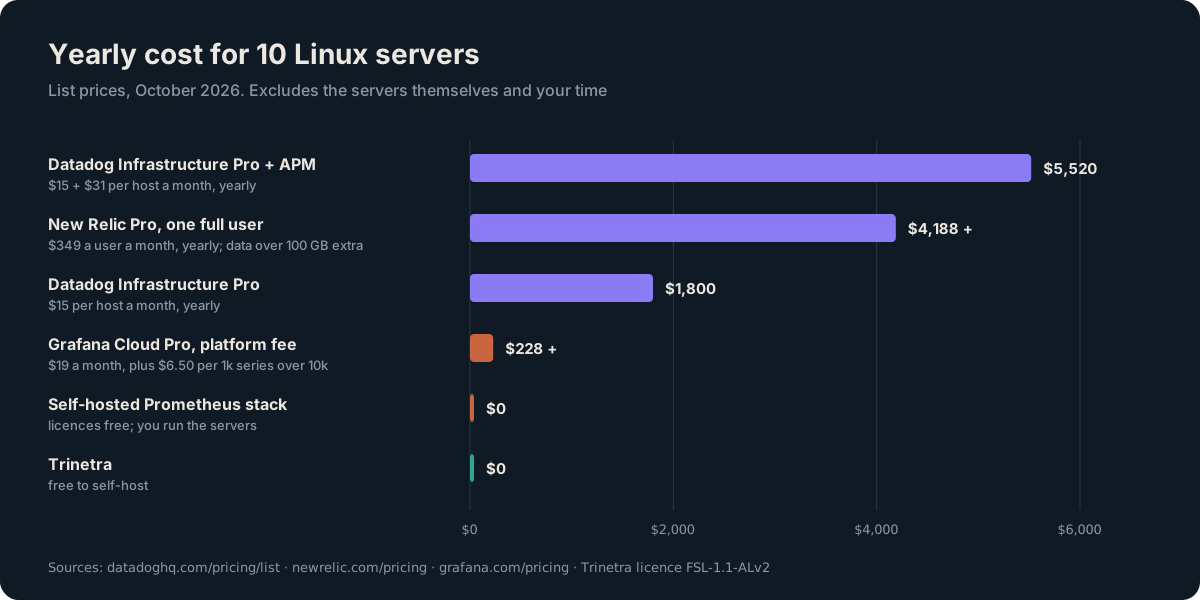
At Datadog's list prices in October 2026, Infrastructure Monitoring Pro is $15 per host per month billed yearly, or $18 on demand. Ten servers is $1,800 a year before anything else. Add APM at $31 per host per month and it is $5,520 a year. Logs are billed separately, at $0.10 per ingested GB plus indexing per million events, and custom metrics beyond the allowance are extra.
New Relic prices by user and by data. The free tier includes 100 GB of ingest a month and one full platform user, and when you pass 100 GB, ingest stops and you lose access to the platform until the next month or until you upgrade. A Pro full platform user is $349 a month on a yearly commitment; ingest beyond 100 GB is $0.40 per GB.
For a funded company with a hundred services, these numbers can be good value. For a startup or a small business watching ten servers, they are a recurring cost that grows with every box you add and every engineer who needs access, for a job that mostly consists of noticing a full disk or a dead container. And every metric, hostname and process name leaves your network to live on a third party's infrastructure.
What we wanted instead
We wrote the requirements down before we wrote any code:
- One thing to install per server. No exporter, no scraper, no separate alerting service, no database to stand up.
- Every server alerts on its own. A central node can add grouping and escalation, but it must never become the reason nobody was paged.
- Rules you can read. A threshold you can see with one command, and a per-host baseline that is plain arithmetic. No model deciding whether to wake you.
- Configured by command, not by hand-editing YAML.
- Small enough not to matter on a VPS or a Raspberry Pi.
- Nothing leaves the network unless you send it.
- Free to run at any number of servers.
Trinetra started as a monitor for a single home server: one Go binary, standard library only, that watched the box and answered on Telegram. Fleet mode and signed self-updates came next, then a public status page. The shape never changed: one daemon per server that collects, stores, decides and notifies by itself.
What it looks like now
Each server runs trinetra. It samples CPU, memory and load every 5 seconds and disks, containers, systemd units and processes every 60, keeps 48 hours of raw samples and 30 days of one-minute rollups, and evaluates its own alerts. We measured it at 11.6 MB of memory and about 0.4% of one core, with no third-party code in the daemon.
With more than one server, one of them becomes the master with sudo trinetra fleet init, and the rest join with a code that pins the master's certificate authority. Children copy their history to the master over mutual TLS and hand it their alerts. The master groups related alerts into one incident, routes it by tag and severity, escalates if nobody acknowledges it, honours silences and maintenance windows, and publishes the services you choose to a public status page. If the master does not confirm an alert within two minutes, the child delivers it itself.
Installing it on a server is one command:
curl -fsSL https://www.infodivelabs.com/products/trinetra/install.sh | sudo sh
sudo trinetra cli
The installer verifies two signatures and every file hash before installing anything, and the guided setup turns on the web UI, creates your admin sign-in link and asks where alerts should go.
When Prometheus is still the right call
We would tell a client to keep or choose Prometheus when:
- You need custom application metrics and PromQL to query them. Trinetra watches the server, not your code, and exports nothing to Prometheus.
- You run Kubernetes or anything else dynamic, where service discovery and labels earn their keep.
- You need exporters for databases, message queues, switches and the long tail of things Prometheus already speaks.
- You already run it well. A working Prometheus stack with someone who owns it is not a problem to solve.
And a hosted platform is the right call when you need logs, traces and APM in one place and would rather pay than operate. If you are weighing self-hosted options, our comparison of Trinetra and Netdata for multi-node fleets covers the other popular choice, including where Netdata is the better tool.
The trade we made
Trinetra does less than Prometheus, deliberately. It samples every 5 and 60 seconds, not every second. It keeps 30 days, not years. It runs on Linux with systemd and nothing else. It has no query language beyond a small grammar for fleet-wide rules. In exchange, there is one thing to install, nothing to babysit, nothing that leaves your network, nothing to pay, and a guarantee that every server will still tell someone when it is in trouble.
For ten servers, that is the trade we wanted. The product page has the full feature list and an honest comparison with Datadog, Prometheus, Netdata, Zabbix and Uptime Kuma, and the launch post explains how it decides when to alert.